EODS Project
Digital Toolkit
About the Digital Toolkit
The EODS Toolkit outlines the EU Election Observation Missions’ (EOMs) methodological approach to analysing the digital ecosystem and supporting Social Media Analysts and Core Team members in assessing online campaigning, information manipulation, and digital trends through a consistent, and transparent framework. In line with the Guidelines on Observing Online Election Campaigns, endorsed under the Declaration of Principles for International Election Observation, the Toolkit strengthens the EU EOMs’ capacity to assess the online information environment effectively.
The Toolkit is:

Dynamic Web Source
A user-friendly platform providing guidance, key resources, and updated materials to support social media analysis, adaptable to rapid digital, legal, and technological changes.
Tailored Support for EU Election Missions
Step-by-step guidance for setting up Social Media Monitoring (SMM) projects during EU EOMs and guidance for experts in charge of digital landscape analysis during Election Expert Missions (EEMs) and Exploratory Missions (ExMs), to ensure an harmonized and consistent approach across missions.
Comprehensive Methodological Hub
A repository of public EODS documents and selected publications from the EU, OSCE/ODIHR, the UN, and major civil society organisations, promoting knowledge-sharing and best practices in the field of social media and elections.
Transparency Tool
This Digital Toolkit provides an overarching view of the European Union’s approach during Election Missions, enhancing transparency and fostering collaboration with other organisation
EODS Templates and Research Papers
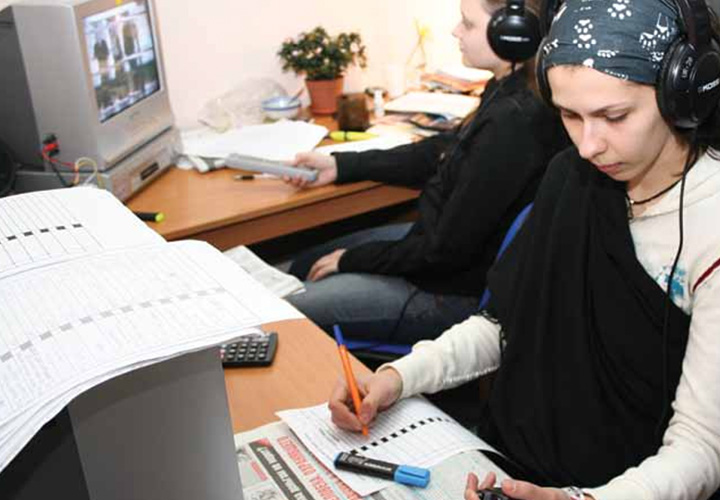
Traditional and Social Media Monitoring
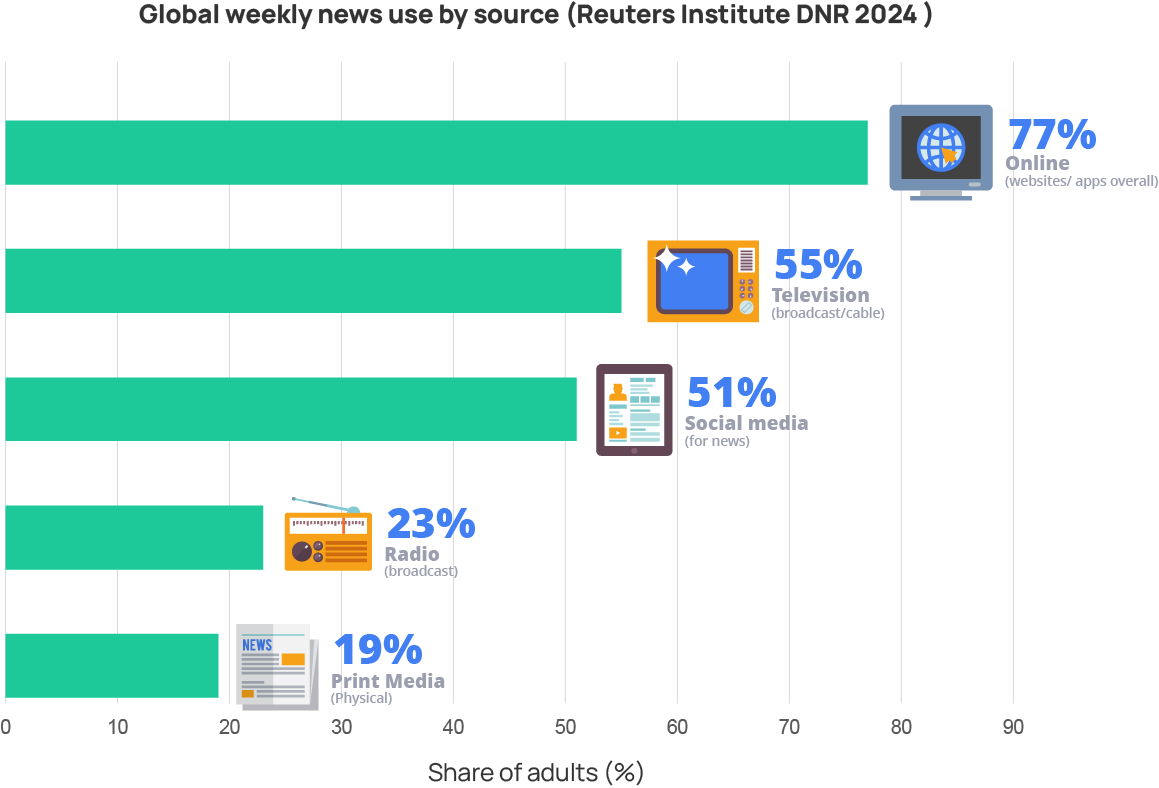
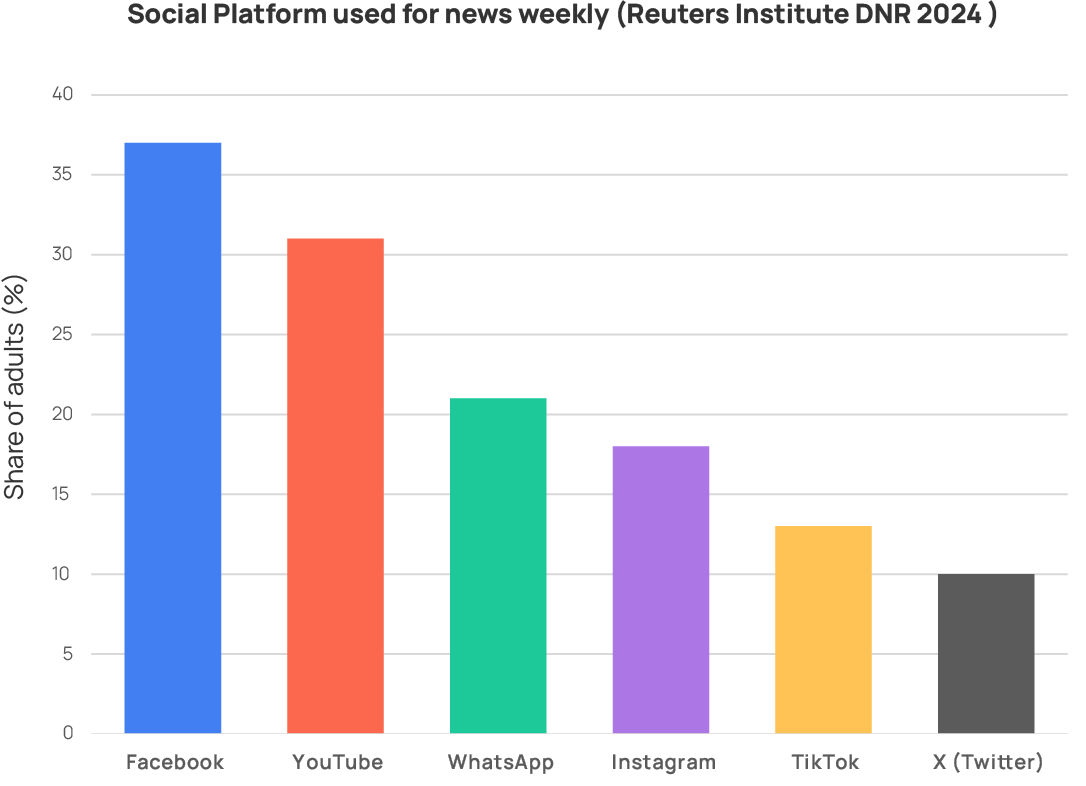
In line with the 2020 Joint Declaration on Freedom of Expression and Elections in the Digital Age by the EU Election Observation Missions (EU EOMs) assess both traditional and online media to ensure a comprehensive understanding of the electoral information environment. The coexistence and interaction between traditional and online platforms shape public discourse and influence voter perceptions during election campaigns (See charts below on global news consumption trends, including online platforms trends).
For this reason, EU EOMs operate through two complementary analytical components: the Traditional Media Monitoring Unit (TMMU) and the Social Media Monitoring Unit (SMMU). The TMMU assesses pluralism, balance and access in print, radio and television including news web-sites and social media accounts of national media outlets. The SMMU analyses online political communication, campaign dynamics and the circulation of information ononline platforms.
Together, these units provide a comprehensive, methodologically coherent assessment of how information flows across media ecosystems, strengthening the mission’s capacity to evaluate the integrity and inclusiveness of electoral processes in the digital age.
Online content within EU EOM Team
The monitoring and analysis of online election-related content is led by the Social Media Analyst (SMA)
The SMA has overall responsibility for this component; however, the analysis of digital election content is a cross-cutting task that benefits from the expertise of the Media Analyst (MA), the Press Officer (PO) and all Core Team (CT) analysts.
The SMA ensures regular collaboration and information exchange with each member of the Core Team to maintain an integrated, coherent analytical approach for EU Mission reporting.
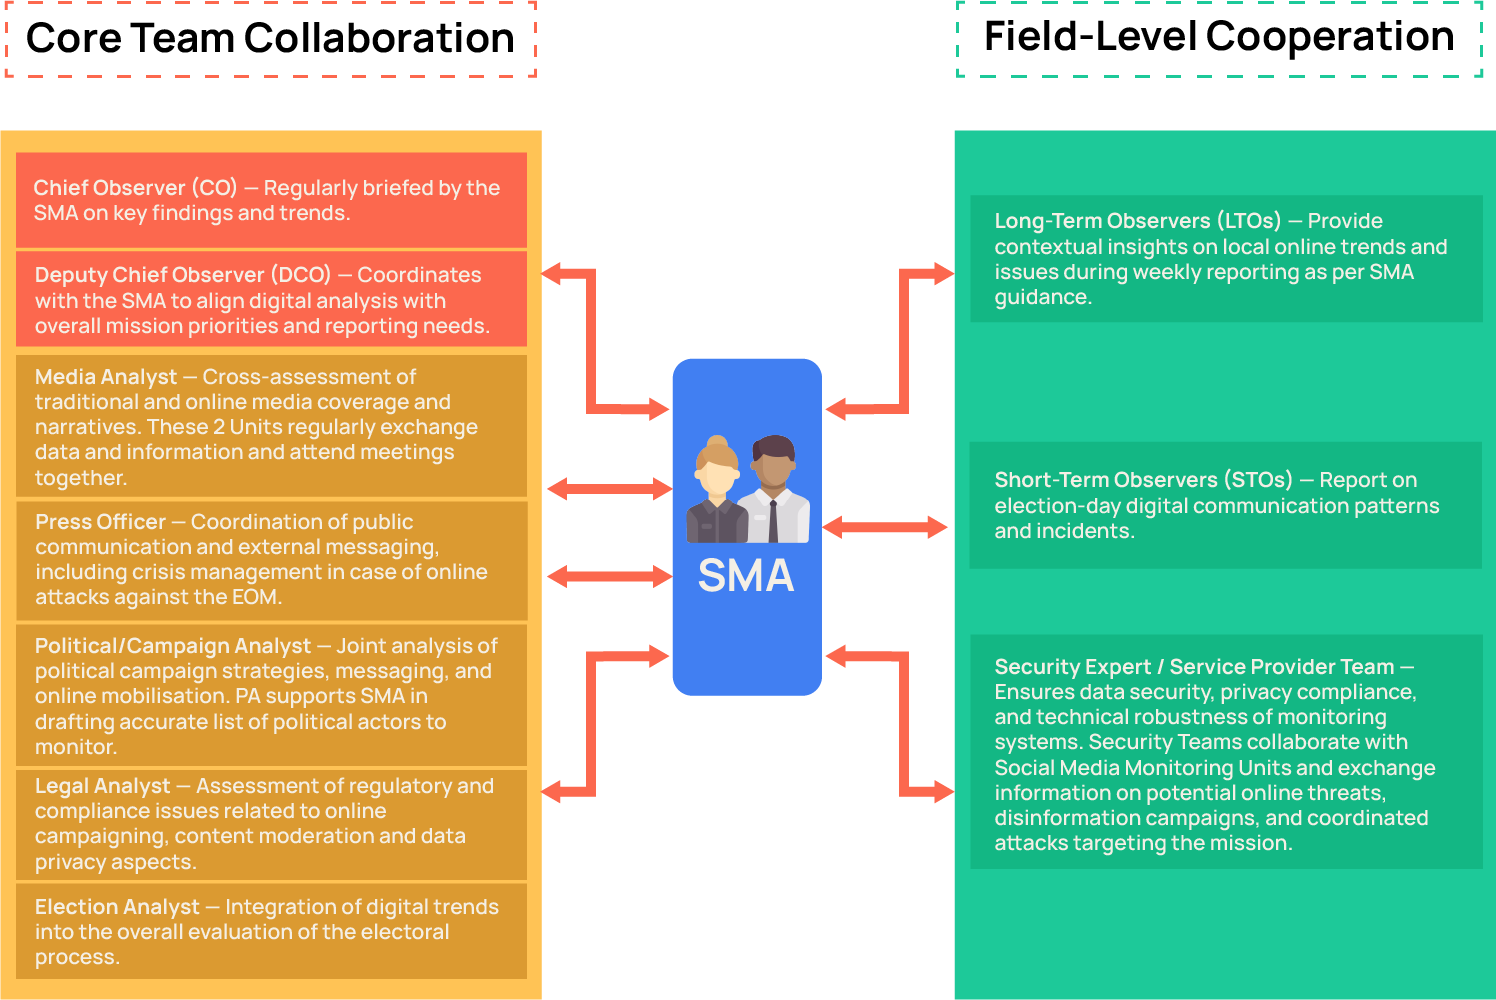
The Social Media Analyst is responsible for assessing the online environment and content related to the electoral process and the campaign. S/he works under the guidance of the Chief Observer (CO) and Deputy Chief Observer (DCO), in close collaboration with all Core Team Members.

Key Responsibilities:
- Identify and map the main social media platforms, online news portals, and digital influencers relevant to the electoral campaign, considering reach, audience engagement, and political relevance.
- Set up and manage the social media monitoring unit, including recruitment, training, and coordination of national analysts and data-collection staff.
- Design and implement a methodology for monitoring online electoral discourse, ensuring compliance with privacy, data-protection, and ethical standards.
- Analyse online campaigning strategies, including paid and organic content, political advertising, and candidates’ or parties’ digital communication.
- Assess the integrity of online information environments, including disinformation, coordinated inauthentic behaviour, harmful speech, and content manipulation.
- Evaluate online narratives related to women, minorities, and other underrepresented groups, including barriers to their participation in the digital campaign space.
- Monitor public reactions to EU EOM visibility and communication in collaboration with the Media Analyst and Press Officer.
- Liaise with civil society organizations, fact-checking initiatives, and relevant authorities engaged in information integrity and online transparency.
- Provide daily or ad-hoc briefings to the Core Team on emerging online trends, risks, or incidents relevant to the electoral process.
- Contribute to interim and final mission reports, ensuring coherent analysis and recommendations related to digital campaigning, social media regulation, and online freedom of expression.
The Media Analyst is responsible for assessing media coverage during the election period and evaluating the overall media environment. S/he works under the guidance of the Chief Observer (CO) and Deputy Chief Observer (DCO), in close collaboration with all Core Team Members.

Key Responsibilities:
- Identify key traditional media outlets for monitoring, considering distribution, audience, ownership, and impact.
- Set up and manage the traditional monitoring unit, including staff recruitment, training, and technical operations.
- Monitor the impact of the EU EOM public outreach strategy in collaboration with the Social Media Analyst and Press Officer.
- Assess media coverage for balance, tone, and adherence to legislation, using both quantitative and qualitative methods.
- Evaluate coverage of women, minorities, and human rights issues, including access to media for underrepresented groups.
- Assess freedom of expression, pluralism, and the media-related legal framework, including codes of conduct and regulatory bodies’ performance.
- Track complaints by political parties against media and assess the mechanisms in place to handle them.
- Maintain contact with civil society organizations engaged in media monitoring.
- Prepare daily briefings on elections and political violence in coordination with the EOM Security Expert.
- Participate in observer briefings, debriefings, and team meetings.
- Contribute to interim reports, preliminary statements, and the final report, including providing targeted recommendations.
The Press Officer is responsible for planning, coordinating, and implementing the EU EOM communication and public outreach strategy. S/he maintains relations with local and international media, ensures visibility of the EU EOM, and organizes press conferences and other outreach activities. The Press Officer works under the supervision of the Chief Observer (CO) and Deputy Chief Observer (DCO) and in close coordination with all mission members.

Key Responsibilities:
- Advise the CO and DCO on strategies to maximize visibility of the EU EOM in local and international media throughout the mission.
- Develop and implement a comprehensive public outreach strategy using traditional and social media, networks of NGOs, political parties, universities, and other relevant channels.
- Establish and maintain contact with local and international media, prepare press distribution lists, and ensure maximum distribution of press releases, statements, and reports to the public and observers.
- Monitor and assess the impact of the EU EOM public outreach strategy across traditional and social media, in coordination with the Media and Social Media Analysts.
- Coordinate the development and maintenance of the mission website, social media accounts, and audiovisual material, ensuring alignment with EU Visibility Guidelines and close cooperation with EU institutions and EODS.
- Prepare and distribute daily media digests, mission factsheets, press releases, press conferences, and media briefings, including translation and adaptation for gender and minority sensitivity.
- Assist the CO and DCO in preparing media interviews, statements, press releases, and press conferences.
- Contribute to interim reports, the preliminary statement, the final report, and internal reporting, ensuring high-quality language, adherence to EU guidelines, and recommendations for methodological improvements or technical assistance.
- Ensure public outreach strategies are inclusive, addressing gender, ethnic, and marginalized groups, and promoting broad access to mission information.
- Participate in observer briefings, debriefings, and Core Team meetings, and liaise with mission members to support communication-related tasks.
- Perform other duties as required, including supporting return visits or roundtables, to ensure the smooth functioning of the EU EOM
Project Set-up
Online campaigning is increasingly important worldwide, as citizens rely more on digital channels for electoral information and candidates use them to reach voters. These channels include online news outlets, party and candidate websites, and, above all, online media platforms, now a major source of election news. For this reason, social media monitoring has become an essential part of election observation.

What is social media monitoring during EU Missions?
Social media monitoring refers to the process of collecting, analyzing, and visualizing trends and activities occurring on social media platforms. It involves using tools and techniques to collect data about hashtags, keywords, and political and electoral actors behavior across online platforms like Facebook, X, Instagram, Tik Tok.
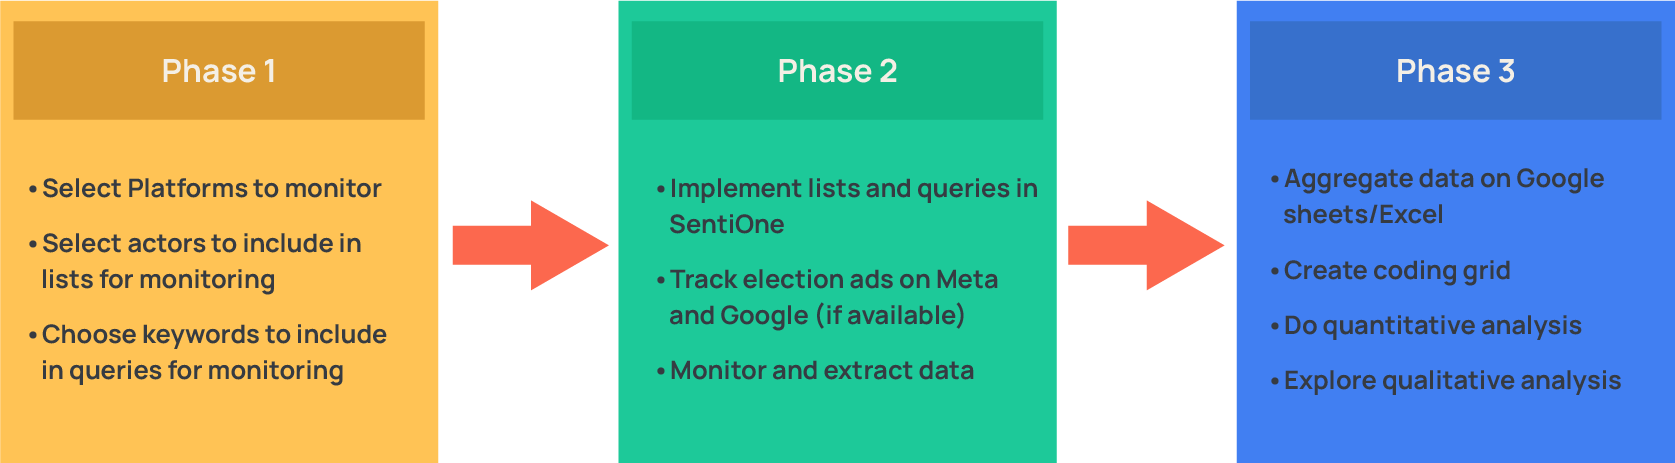
The EU Social Media Monitoring (SMM) methodology is designed for EU election observation missions to monitor social media platforms systematically. It collects and analyzes election-related content to provide consistent, objective data on the role of social media in the electoral process. These findings form the basis for EU EOM Final Report and Recommendations to stakeholders.
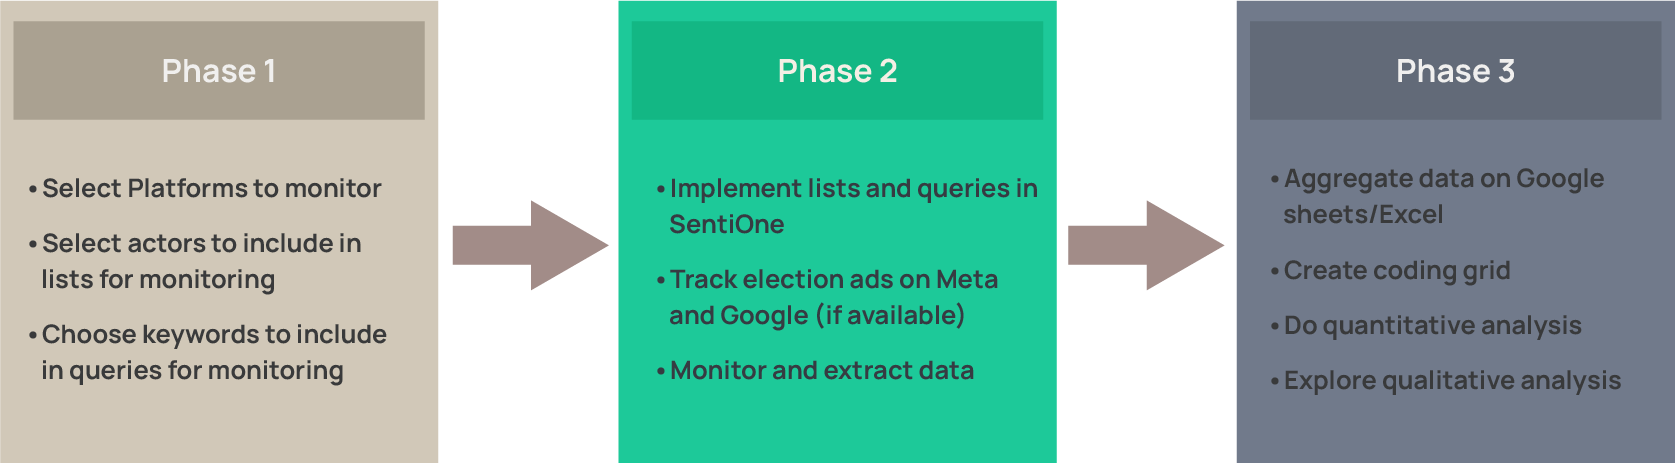
The chart below helps the experts to establish a framework for observing election-related content online:
The implementation of the EOM/EEM social media monitoring project develops along 3 phases:
Mapping Online Environment
DESK REVIEW
The DESK REVIEW is the first step to understand the country’s online information environment.
The free tools in this section will allow EEAS Policy Officers and Election Missions Teams to begin mapping the digital and media landscape, offering quick insights into platforms, narratives, and trends relevant to the national context. They are particularly useful for pre-mission preparation or when exploring new country contexts.
For accurate and comparable results, ensure that each search is guided by a clearly defined topic (e.g., political actor, electoral issue, or policy debate).
- Datareportal latest stats
- Datareportal latest country stats
- Statista stats
- Napoleon Cat stats
- Emplifi industry benchmarks
- Latest Digital News Report
- Digital News Report country data
- Google Search is considered a valuable tool for exploratory analysis.
- Google Trends provides info about trends in Google Search.
Setting Up Social Media Monitoring Projects
Assessing election processes on social media requires a solid methodology to ensure that observations, conclusions, and recommendations in the final report are objective and evidence-based. Findings should not appear subjective or discretionary, but supported by verifiable data and reproducible methods. To achieve this, a Monitoring Project must be built on 3 main pillars:
Social Media Methodological Framework
The SMM Framework provides a quantitative/descriptive analysis and a qualitative/explanatory analysis. The quantitative data from social media feeds a qualitative analysis of the role, reach or nature of the discourse on social media.
|
|
|
|
|
|
|
Identify the most relevant social media platforms in the country of the mission:
- Research which are the social media platforms with most users;
- Assess the prevalence of political and electoral content on those platforms, Some may have a large number of users but scarce political content;
- Analyse the existence of tools to monitor content on those platforms;
- Choose 3 to 5 platforms, depending on the capacity of your team;
- WhatsApp and other messaging platforms are out of scope due to data protection and privacy issues.
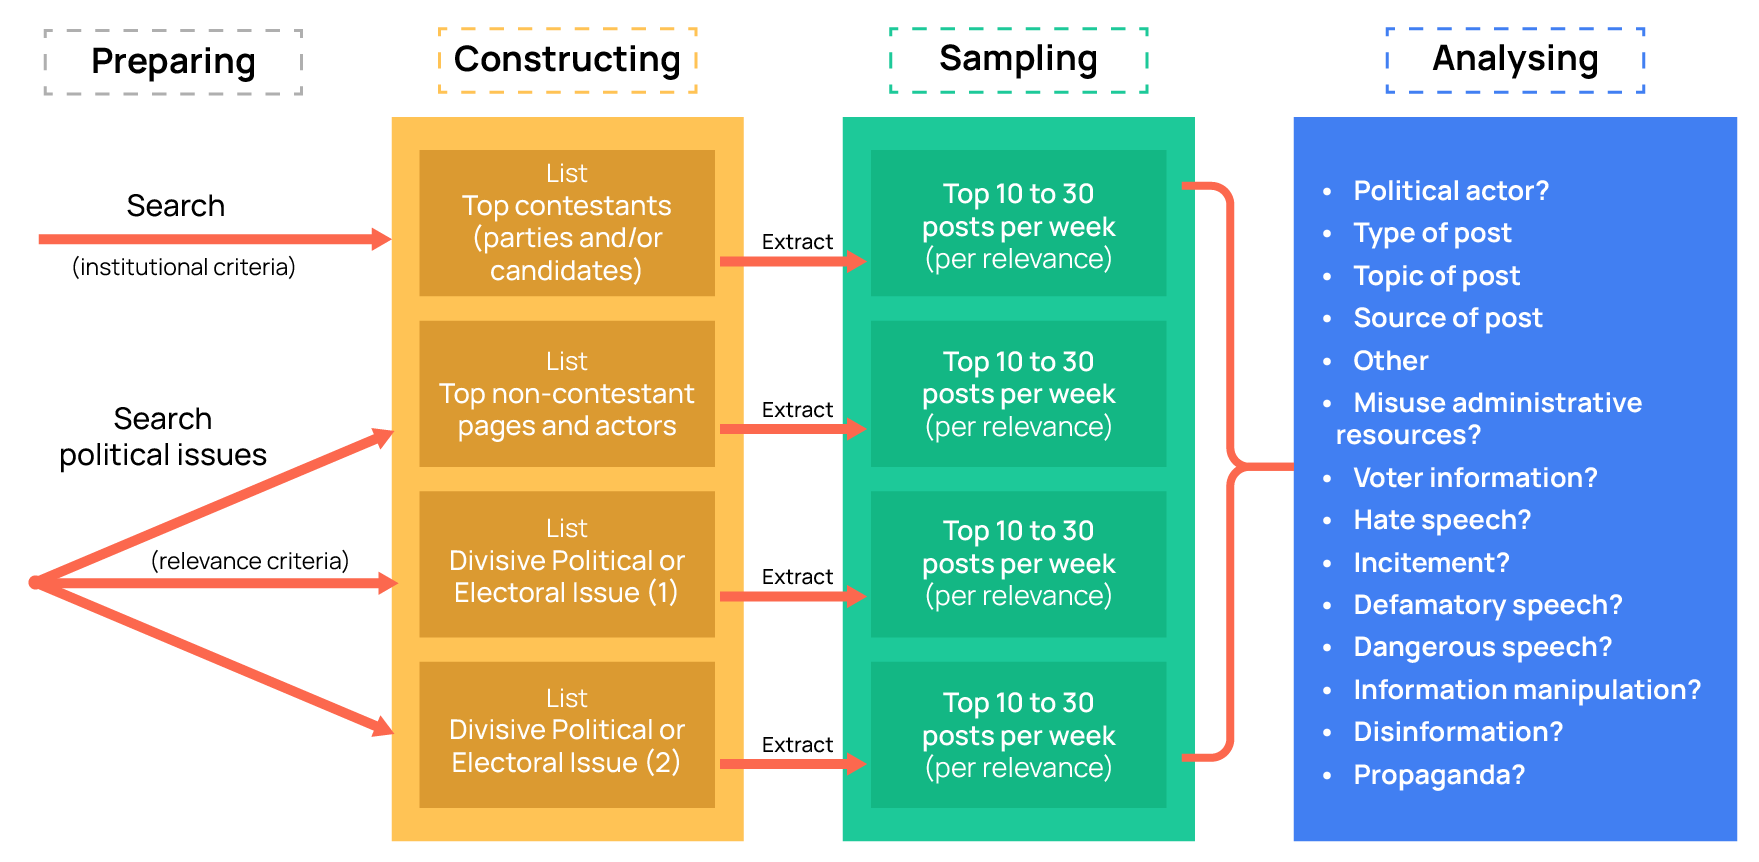
Develop and implement a Framework for collecting and analysing data (see proposed framework below):
- Establish lists of relevant social media actors to monitor;
- Establish search queries around relevant sets of keywords;
- Extract the most relevant posts in each list and query and analyse them as a significant sample
Construct the monitoring lists and queries by:
- Selecting institutional actors according to their institutional role (official candidates and/or governmental actors);
- Select third-party accounts with political relevance (previously assessing that political relevance)
- Create search queries for the divisive or polarising issues (e.g., derogatory language; racism) using the same procedure. When identifying sensitive or high-risk topics (‘triggers’), SMAs should keep in mind the four areas of assessment set out in this toolkit: online campaigning, online political advertising, information manipulation, and Derogatory Speech and/or Hateful Content. Topics that are likely to generate problems in any of these areas (for example, narratives about voting procedures, polarising identity-based issues, or online harassment of candidates) should be flagged early and monitored throughout the mission
- Construct a significant sample of posts to analyse. Select which posts to analyse by ordering posts by impact in each timeframe (e.g., 10 posts per week, 30 postsper month).
In this toolkit, we use online impact as a shorthand for the combined effect of reach, engagement and virality of a piece of content or an actor’s activity. On each platform, the Social Media Analyst should identify which available metric (for example, views, impressions, interactions or an influence score) is the best proxy for online impact. This metric will be used as the relevance criterion when sampling posts and actors for qualitative analysis.
FRAMEWORK FOR EOMs to construct “significant” lists of actors and “significant” samples of data:
NOTE: This is a proposal. It should be adjusted to local context.
Before starting regular data collection, the SMA should establish baseline or “normal” levels of online impact for the main platforms and actor categories in the country. Using the desk-review tools (see Phase 1.1 – Desk review – main tools) and an initial exploration of key accounts (candidates, parties, major news outlets, influential third-party pages), the SMA should estimate, for each platform:
- Typical ranges of followers for these actors;
- Typical ranges of interactions per post (reactions, comments, shares);
- Typical ranges of views or impressions for posts and videos.
These baselines allow the mission to distinguish between normal content (within the usual range of online impact for that actor), high-impact content (significantly above the usual range) and viral content (high-impact content that also spreads unusually quickly or across platforms). Because online audiences vary greatly between countries, the same absolute number (for example, three million views on a video) may be exceptional in one context and common in another. Each mission should therefore define its own low/medium/high/viral bands for online impact and use them consistently in the analysis.
This methodological framework is designed to highlight the RELEVANCE of the publications as its primary focus. When thinking about the potential impact of each piece of social media content (posts, photos, videos, etc), we must take into account how many people contacted or interacted with that content, because that contact or interaction is a measure of the attention being paid to it. If only 100 people saw a given piece of content, that piece of content is less influential than another piece of content that was seen or interacted with by 100.000 people. That's why the methodological framework includes the relevance of the publications - usually measured by views or interactions - as its mains focus.
Selecting platforms to monitor
Questions to be answered:
- Which social media platforms are most relevant?
- Which are most used by which age groups and social/political actors?
- Which are more prone to information manipulation and/or derogatory language?
- Is information manipulation prevalent? On which platforms?
- Is the Facebook Ad Library available? Do candidates or supporters use political ads?
- Is Derogatory Speech and Hateful Content an issue? On which platforms? Towards which groups?
- Do government and electoral bodies have social media presence?
- Are political influencers active on social media? If so, on which platforms?
Sources:
Use the tools described in Desk review – main tools, combined with:
» Exploratory searches on the platforms themselves
» social listening tools (when available)
» Consult with local stakeholders
NOTE: EEMs use the same Phase-1 guiding questions and sources as outlined in the ‘Phase 1 – Mapping the online environment’ section of this Toolkit, but typically limit monitoring to a maximum of two platforms and do not implement keyword queries unless explicitly requested
Selecting actors to include in the lists
Prepare and construct lists of top institutional pages and actors
Go to candidates' websites and track their presence on social media. Register the URL and the number of followers on a Google sheet of Excel file for future reference.
Whenever possible, try to use institutional criteria, like the official list of election candidates or the list of parties with seats in the parliament.
Prepare and construct lists of top non-institutional pages and actors
Search and track the most relevant pages or accounts talking about the election, including political influencers or political pages not running in the election. Register the URL and the number of followers on a Google sheet of Excel file for future reference. Use keywords related to the election or the political situation and try to identify public accounts or pages, either personal or non personal, with significant followings and predominant political content.
Choosing keywords to include in queries
Search for political and electoral issues using keywords that are relevant to the election. If necessary, consult with local stakeholders to identify 5 to 10 initial keywords.
Then run those keywords in Google search, Google Trends, social media platforms and social media listening tools to identify other words that are used in relation to those and choose the ones that are most relevant (most used and most directly related to the election). Pay special attention to other search suggestions on Google Search and Google Trends
You may want to use boolean search operators to perform the search and to construct the query.
Consider creating at least two queries:
- one directly related to the election (the name of the candidates or parties in the election is a good possibility);
- one related to a polarizing/divisive issue relevant in the election (eg: ethnic/racial divides; corruption; immigration, etc). Consult with local stakeholders to pinpoint these issues. If there are more than one divisive/polarizing issue, consider two independent queries of this type. This kind of search queries tend to surface the most problematic content regarding information manipulation and/or derogatory speech.
Check List for EOM ExM and EEM
A checklist is essentially a structured set of questions for Social Media Analysts (SMAs) and other Experts deployed in Election Observation Missions (EOMs), Election Expert Missions (EEMs), and Election Exploratory Missions (ExMs). Its purpose is to ensure a systematic, consistent, and comprehensive approach when engaging with interlocutors and key election stakeholders.
The following check-list is organized by 9 thematic areas:
- Is there an ownership concentration over Internet Service Providers (ISPs)? If yes, how does it affect access to the internet? If not, how are the legal, regulatory, or economic conditions for becoming an ISP? Are registration requirements for ISPs and any other access providers approved/rejected on partisan or prejudicial grounds?
- What is the legal and regulatory regime for Information and Communication Technologies (ICTs) infrastructure?
- To what extent do infrastructural and economic limitations restrict access to the internet?
- Does the primary legislation, including, but not limited to, anti-terrorism legislation, defamation laws, cyber security laws, conform with international standards for freedom of expression? For example, does the legal framework include criminal liability for online defamation or insult of state officials? Are restrictions over online content transparent, proportional to the pursued aims, and appealable through an independent and fair mechanism?
- Are online journalists, bloggers, or other content providers sued, prosecuted, jailed, or fined for their publications? If so, is their right to effective remedy and due process respected? Are they subject to extra-legal intimidation? Is such a legislative framework conducive to self-censorship online?
- Is the online environment providing for a diversity of sources of information, a variety of contents, ideas and views?
- Does the country have a data protection regime? Does the national law on data protection apply to the data collected and used (processed) by political parties and other political actors? Does it sufficiently protect voters’ data against commercial and political exploitation?
- Is there a privacy regulator? Are privacy regulators independent from political interference? Are they sufficiently resourced? Do they have sufficient enforcement powers (such as the ability to issue substantial fines)? Is the decision-making process transparent and subject to a judicial review?
- Is there any history of data breach or data being exposed in the country, especially during election periods? How did authorities, EMB, parties respond?
- Do political parties and other political actors have data protection policies? Do they disclose where they get the personal voters’ data from and what they do with it?
- Have political parties, third parties and other relevant actors obtained consent for the individuals prior using their data or how else do they justify holding the data? Is there an option to opt out for users?
- Is profiling, microtargeting, artificial intelligence/machine learning used in the campaign?
- Do private companies work on applications using personal data by request of the EMB? Is the privacy of this data guaranteed?
- Are political parties granted access to electronic voters’ registers or biometric databases? Is this access granted with respect for privacy rights?
- Are voters aware of the use of personal data and trained to protect personal data?
- Do EMB have effective procedures in place to prevent or respond to information manipulation operations that risk harming the integrity or functionality of the process?
- Are the relevant members of the EMB adequately trained to understand the challenges posed in the online environment?
- Does the EMB conduct any social media monitoring activities?
- Does the EMB or other relevant state authorities have established any form of cooperation with the social media platforms? If yes, what does it entail? How formal is such an agreement?
- Does the EMB resort to the Internet and social media platforms to conduct voter information and civic education campaigns? Do social media platforms support such efforts? If yes, how do platforms contribute to educating voters and disseminating election-related information online?
- Does the EMB publish information of public interest (decisions, election calendar, polling stations results, etc.) on their website and social media accounts? Is such information comprehensive, accurate, non-partisan and easy to access? What is the level of interactivity for users provided by the web tools used by EMB?
- Does the EMB use social media platforms to provide specific assistance to users via online Q&A or special hashtags for voters to ask questions to the EMB?
- Does Google, Facebook and Twitter have an in-country contact person/office/content moderation team? What mechanism is available for reporting abuse and addressing complaints? From which regional or international office do the relevant tech companies cover the host country (if an in-country team is not present)?
- What is the internet penetration, digital and media literacy rate in the host country? How many users are registered for each social media platform and what is the reach of other online platforms? What type of pages/accounts have the largest audiences? What is the relevance of closed groups and instant messaging in political communication? What is the dominant language used on social media platforms?
- Who are key bloggers/influencers/discussion groups setting the agenda on social, political and election-related topics? Do they support/oppose a particular electoral contestant?
- Do the government/public institutions/executive-level state officials use the Internet and social media platforms to communicate with citizens? Do they publish information of public interest online? Are they required to publish it? Is published content non-partisan or rather is it instrumental to campaign or propaganda purposes?
- Are civil society organisations (CSOs) using online communication tools to mobilise and inform voters on relevant matters regarding the elections? Do CSOs use social platforms and online tools to monitor state institutions at central and local level? Do CSO use crowdsourcing and other cooperative online tools to observe elections and report on incidents, malfunctions and alleged frauds?
- Are media and digital literacy rates developed enough to allow citizens to fully exploit the use of the Internet? Are relevant state authorities, civil society or tech companies implementing programmes to raise digital and media literacy?
- Is campaigning online regulated by electoral legislation and/or by supplementary regulations, issued by the EMB or another state authority (for example, by a regulator)? Is there a voluntary code of conduct governing the conduct of political parties and candidates during the campaign period? Are prohibitions on hate speech, discrimination, and information manipulation featured in the code of conduct?
- Are there any regulations regarding campaign silence online? Do social media platforms respect such provisions (if any)? Is there a paid political campaign ongoing on platforms during the campaign silence? Are any measures taken either by the platforms or by EMB and other competent authorities against paid campaigns during the campaign silence?
- Are there any regulations related to the publication of opinion/exit polls? Do online platforms respect such provisions? Are opinion polls pushed across digital platforms in the form of sponsored content?
- Has artificial intelligence been deployed to harm candidates? If so, are there initiatives educating the public on the risks of doctored material, including video or audio material?
- What is the online presence of electoral contestants (how many followers they have, which platforms they use, etc)? What are the campaign strategies online? In which ways political actors engage with voters, and which are the online campaign tools and the data they use in their campaigns? What are the contents, topics, tone, and the type of interaction they adopt to communicate online?
- Are political contestants resorting to information manipulation techniques (bots, trolling, fake accounts, search engine manipulation, etc.) to campaign?
- Are electoral contestants using other digital campaign tools, such as direct messaging or mobile applications for campaign purposes, including on E-day?
- Are political campaigns online targeting any particular ethnic or religious group in both, a positive or a discriminatory way? Are political campaigns online encouraging participation by women, persons with disabilities and other vulnerable groups? Are there campaigns, including online harassment, doxxing, astroturfing of demeaning information, that discourage their participation in the elections?
- Are third parties campaigning for or against a certain candidate? If so, what messages do such campaigns promote? What campaign methods do they employ; do they include sponsored content?
- Are state institutions and executive-level public officials campaigning for or against a certain candidate from their official social media accounts? Do such campaigns (if any) also include sponsored content and political advertisement? Who benefits from such campaigns?
- Have parties signed codes of conduct for avoiding inflammatory language (etc.) in the social media during the campaign?
- Are there any legal provisions outlawing the distribution of content deemed harmful? If so which kind of contents are included, are definitions of such content clearly stipulated in the law? What penalties are foreseen for spreading such content? Are detentions and prosecutions on such charges carried out in a non-discriminatory manner or are they used to silence voices of dissent?
- Is there evidence of coordinated and automated information operations (e.g. bots used to amplify messages and contents related to elections)? Is there evidence of trolls and human curated fake accounts being used in the campaign?
- Is there evidence of coordinated information manipulation campaigns aiming at discrediting a certain political actor, EMB or to undermine the integrity of the electoral process as a whole? Which channels are being used to disseminate manipulated information? What policies do platforms have to monitor/downrank such content?
- Are there accounts/pages that promote violence, sow discord or propagate discrimination? If yes, how large are their audiences? Is the content originating from such accounts/pages shared by electoral contestants? Is there any instance of such content being shared by print and broadcast media outlets? Is such content pushed across various platforms in a form of sponsored content?
- Are there electoral contestants that use hateful content/derogatory speech and/or spread disinformation on their official accounts? Do candidates and parties contribute to inflaming the campaign rhetoric on the web or rather they tend to moderate views and comments posted? Are EMB or other relevant state authorities taking any measures against such electoral contestants?
- Is there a suppression of credible news? If yes, what kind of news do such campaigns aim to discredit?
- What initiatives exist in the host country to fight disinformation and hateful content? Are they state-sponsored, promoted by civil society or other entities or by social media platforms? If there are fact-checking initiatives, are they credible and nonpartisan? Is there a cooperation between fact-checking initiatives and mainstream media? Do social networks cooperate with fact-checking services/initiatives? Are these initiatives professional/efficient? Have organisations working on fact-checking projects been accredited by international networks of fact-checkers, such as the Poynter Institute?
- Are social networks offering its users any technological solutions to disinformation and harmful content which users may apply on a voluntary basis?
- Are there any initiatives monitoring hateful content and derogatory speech and information manipulation levels during the elections?
- Is online political advertisement and issue-based advertisement defined and regulated in law and/or in regulations governing the campaign? Who is to oversee the compliance with the law and respective regulations? Is the oversight effective, are technical, human, and financial resources sufficient? Is the EMB or other regulatory institution monitoring campaign spending by candidates on social networks?
- Are there any legally binding reporting and disclosure requirements for electoral contestants? Who is to oversee the compliance with those requirements? How detailed are those requirements? Within which timescale? What are the sanctions for failing to comply? Are electoral contestants actually disclosing their online campaigning expenditures with sufficient detail to allow for a proper oversight?
- Are there any reporting and disclosure requirements for service providers, such as media, advertising agencies and tech companies? If not, do tech companies voluntarily report on such spending? Is such information available for regulatory bodies only, or also for the public? In what level of detail?
- Is information related to party and campaign finance, including lists of donors and disaggregated reports on campaign expenditures, published online? If yes, is such information published in a format that grants easy and prompt access to such information to the general population?
- Is the third-party campaign permitted in the host country? Is third-party campaigning in a form of sponsored content and paid advertisement observed? Would expenditures related to it factor in electoral contestant’s campaign spending? Are there any limitations on such third-party spending?
- Have the main Internet platforms operating in the host country developed policies for transparency of political ads and other political communications, and transparency of targeting? Is Facebook’s Ad Library fully rolled out for the host country? Is information about ads restricted to only those paid by contestants, or such information is also available for content sponsored by third parties?
- Is there a legal requirement to clearly label all political advertising as such? If so, is this rule respected online? Is there a legal requirement to display information about who sponsored the political advertising? If so, is this rule respected online? Are platforms adopting appropriate and efficient measures to ensure that political ads are clearly distinguishable and are readily recognisable as a paid-for communication or labelled as such?
- How important is social media in your campaign strategy compared with traditional media?
- Which online platforms (e.g., Facebook, X/Twitter, Instagram, TikTok) are most effective for reaching your target audience?
- What are your key objectives for online campaigning : visibility, voter mobilisation, fundraising, or shaping public debate?
- Do you use data analytics, targeted advertising, or influencers to reach specific voter groups?
- How do you ensure compliance with national regulations on online campaigning and paid advertising?
- Have you faced or observed disinformation, smear campaigns, or coordinated manipulation online? If so, how do you respond?
- What measures do you take to protect your candidates and supporters from online harassment, hate speech, or privacy violations?
- How do you manage your social media content: is it handled internally or by external consultants?
- Are women candidates and minority representatives in your party equally visible and active online?
- How would you describe the tone of the online campaign environment — more open and pluralistic, or more polarized and aggressive?
- Do you believe social media has improved citizens’ access to information, or does it risk spreading misinformation?
- How does online campaigning influence your relationship with traditional media and journalists?
- How would you describe your access to traditional media during the campaign: equitable, limited, or influenced by ownership and affiliations?
- Do you feel that television, radio, and print outlets provide fair and balanced coverage of your campaign?
- Have you been invited to participate in debates, interviews, or election-focused programmes? If not, what barriers have you faced?
- Are you satisfied with the access, cost, and transparency of paid political advertising?
- Have you experienced any bias, editorial restrictions, or forms of indirect pressure from media outlets?
- How do you evaluate the coverage of women candidates, minority groups, and smaller parties in traditional media?
- Do you believe public/state media fulfil their obligation to provide balanced and impartial information?
- Have you filed or considered filing any complaints related to media coverage or access?
- How do you view the interaction between traditional and online media in shaping voter opinion?
- Overall, how would you rate the fairness, accuracy, and professionalism of media coverage during this campaign?
International Standards
EU Election Observation Missions assess digital election-related content against international and regional human rights standards, including commitments and good practices related to freedom of expression, political participation, privacy, and non-discrimination. Online campaigns, digital content, and relevant legal frameworks are therefore evaluated for compliance with these standards.
Where specific issues are not explicitly covered by binding international instruments, assessments rely on established guidelines and good practices developed by international and regional organisations. While international human rights standards provide a broad analytical framework, legally binding norms remain uneven in some areas.
Summary table of principles and main international standards:
| GENERAL PRINCIPLE | MAIN INTERNATIONAL COMMITMENTS/STANDARDS | AREA OF ASSESSMENT/OBSERVATION |
| Freedom of expression | ICCPR art. 19 CCPR General Comment No 34 | Content regulation, including hate speech, defamation, and disinformation |
| Right to political participation | ICCPR art. 25 CCPR General Comment No 25 | Information manipulation, including inauthentic behaviour, disinformation Political suppression, intimidation, threats Derogatory speech, hateful content Platforms’ transparency on recommendation and moderation algorithms, access to data for scrutiny, transparency reports. |
| Privacy and data protection | ICCPR art. 17 CCPR General Comment No 16 CCPR General Comment No 34 | Data acquisition and processing Micro targeting Profiling |
| Access to information | ICCPR art. 19 CCPR General Comment No 34 | Access to the Internet, including filtering and blocking Election information, including about campaign financing Voter education Media and digital literacy |
| Transparency | United Nations Convention against Corruption | Election-related advertising Sponsored content Information manipulation, including microtargeting, bots, fake accounts. |
| Equality and freedom from discrimination | ICCPR art. 3 CCPR General Comment No 18 | Derogatory speech, hateful content Incitement, suppression of certain groups of voters Net neutrality |
| Right to an effective remedy | ICCPR art. 2.3 CCPR General Comment No 31 | Election dispute resolution Social media platforms voluntary compliance measures Social media platforms’ reporting system and appeal mechanisms |
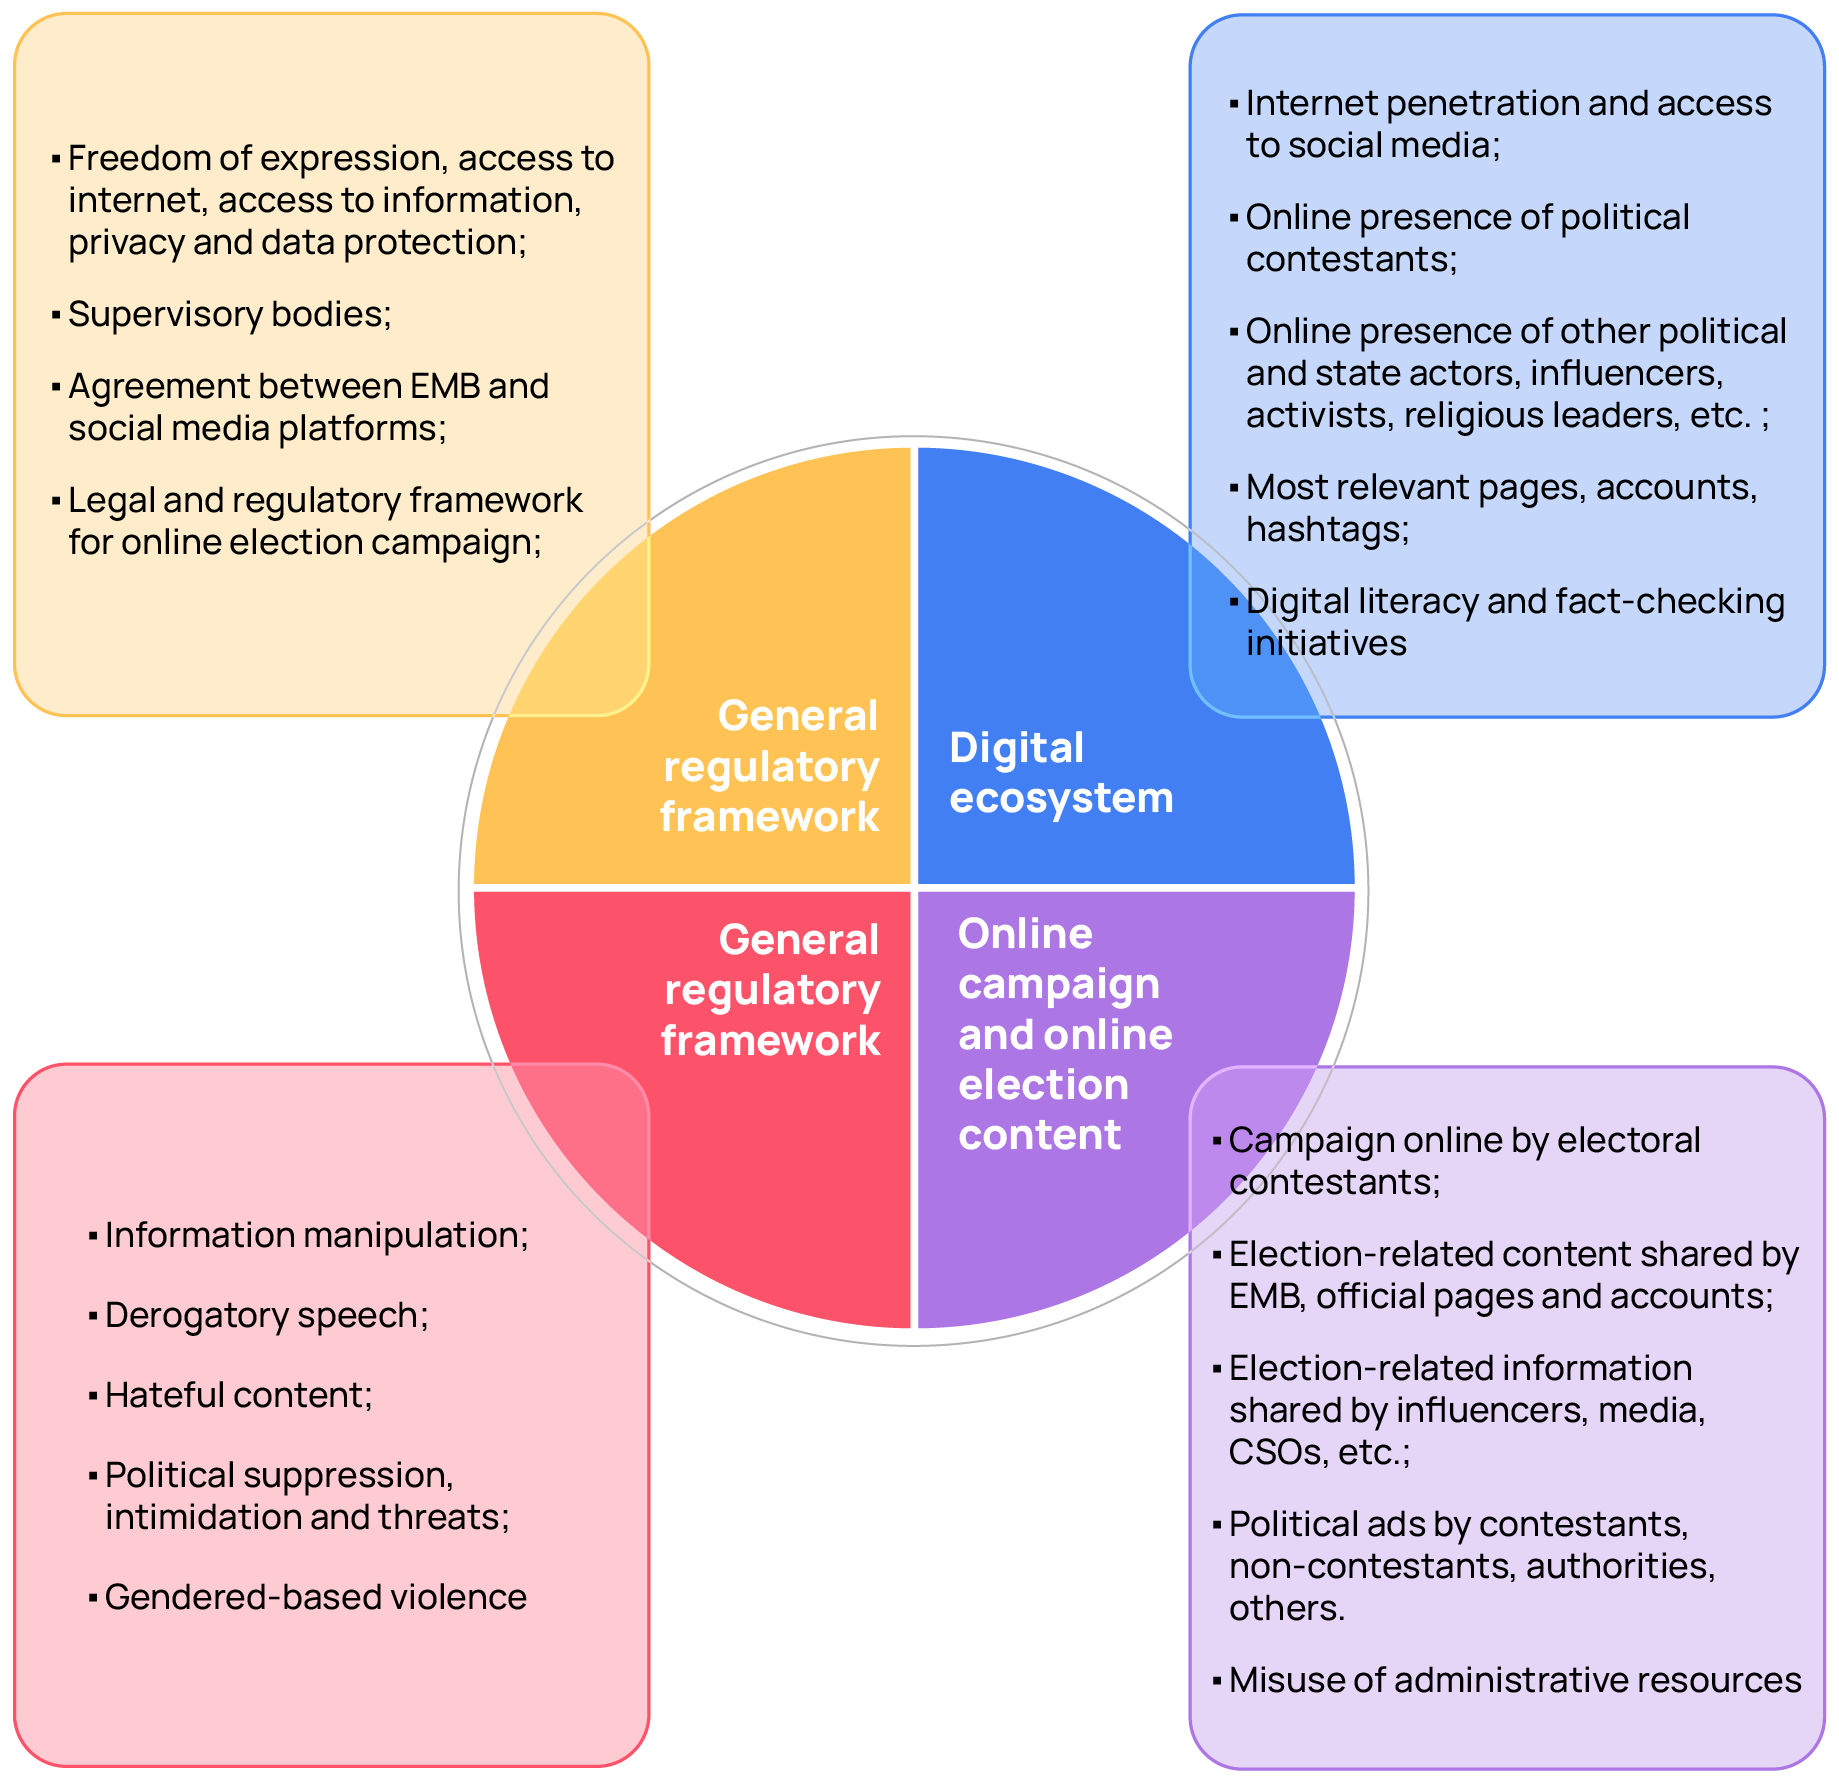
4 Areas of assessment
Analytical Framework
The analytical framework of this Toolkit is built around four areas of assessment that apply to all mission types (ExM, EEM and EOM): online campaigning, online political advertising, information manipulation, and derogatory or hateful content. These areas provide the main lenses for understanding how digital communication affects electoral integrity and fundamental rights.
Each area is linked to specific international standards, such as freedom of expression, equality and non-discrimination, transparency and the right to political participation (see International Standards table below). Across all four areas, observers should consider not only what is happening, but also:
- its online impact (how visible, engaging or viral it is); and
- its potential harm (how seriously it may affect rights, participation, safety or trust in the process).
The following subsections briefly define each area of assessment and show how they relate to broader international standards. Detailed guidance on data collection and analysis is provided in Phase 2 and in the “Online campaign: Analysis and Research” section.
The Toolkit identifies the four areas of assessment and provides specific guidance on how to monitor content on social media platforms to produce a solid analysis. These four main areas include:
Online Campaign
by electoral contestants and other stakeholders
Political Advertising
placed on online platforms by electoral contestants and other stakeholders
Information Manipulation
efforts identified including coordinated (in)authentic behaviour
Hate Speech
and possible instances of hateful content spread during the election campaign
1 - Online Campaigning
In this area of assessment, the goal is to monitor how party and candidate accounts use social media during the election to carry out their campaign online. This area focuses on their organic communication (posts, comments, interactions) across platforms. Paid or sponsored online content is covered separately under the Political Advertising area of assessment.
The sample for this area of observation should be all social media posts per candidate and party in a defined timeframe. Although, some threshold to limit the scope may be required. In the cases when the number of candidates/parties and the total posts per per candidate/party per week exceeds the capacity of the team, try to observe primarily the most relevant publications for all candidates/parties or for each candidate/party (see Methodological frameworks section for reference).
Given the data available to researchers, see the possible research areas:
- Social media usage per candidate/party
- Top social media platforms used for campaigning
- User engagement with party/candidate accounts
- Use of negative or positive campaigning techniques by parties/candidates (define 'negative' carefully and with sense)
- Topics discussed by party/candidates
- False claims or Derogatory Speech and Hateful Content threatening electoral integrity
Consider cross-referencing sections on “Information Manipulation” and “Derogatory Speech and Hateful Content” to understand if such harmful techniques are being used by official party or candidate accounts.
For step-by-step guidance on sampling, data collection and analysis of party and candidate accounts, including suggested research questions and examples, see Phase 2 – Implementing monitoring & collecting data (social media listening tools) and the ‘Online campaigning’ chapter in the Online campaign: Analysis and Research section.
2 - Political advertising
This area of assessment aims to understand how contestants and other stakeholders use political advertising on social media. However, lack of available data may severely limit the depth of analysis in this area. It is a specific sub-area of the online campaign that focuses on paid or sponsored content, where money is spent to promote messages to selected audiences.
First of all, assess if there are legal provisions for online political advertising and ask candidates, where possible, if they plan on buying online advertising, and if so, on which online platforms.
A further research area not covered here would be to understand the online political ad use by non-contestants. Most problematic content is usually not pushed by official candidates, so understanding non-contestants advertising is highly important. Such an approach would require analysts to search for candidates and parties as “keywords” rather than by official accounts. Then, posts campaigning for or against the candidate could be labelled and quantified.
Using such a keyword search approach is only possible using the Meta Ad Library API and not the Ad Library Report or Google’s Political advertising transparency report which only allows you to search by advertiser. For guidance on data collection in this area, including the use of Meta and Google ad transparency tools and the fields to export (impressions, spend, targeting, dates, creatives), see Phase 2 – Implementing monitoring & collecting data (Online political advertising tools). For analysis and interpretation of political advertising patterns and risks, see the ‘Political Paid Content’ chapter in the Online campaign: Analysis and Research section, which explains how these data can be used to answer questions about transparency, spending, targeting and potential misuse of state resources.
3 - Information Manipulation
Influence operations seek to shape public opinion and behaviour, including during elections, and they can use many different tools — political messaging, pressure on institutions, offline mobilisation, or digital tactics. When these operations take place in the information space, they manifest through information manipulation, meaning deliberate attempts to distort, influence, or restrict the information voters can access.
Information manipulation includes several distinct techniques: 1) content manipulation (e.g., disinformation, misleading framing, deceptive visuals), 2) behavioural or algorithmic manipulation (e.g., inorganic amplification, coordinated engagement, bot activity), and 3) information suppression (e.g., mass reporting, cyberattacks, platform-level blocking). These should not be confused with broader hybrid operations, which combine diplomatic, military, economic, cyber, or covert tools — sometimes including information manipulation but not limited to it. Crucially, identifying manipulation patterns in an election does not mean identifying Foreign Information Manipulation and Interference (FIMI). FIMI is a behaviour category requiring attribution — determining that a foreign state or state-linked actor is behind the activity. Since election observation missions cannot conduct attribution, they should report observable manipulation techniques and impacts, not classify cases as FIMI.
Information manipulation can consist of different and integrated tactics, techniques and procedures (TTPs, e.g. coordinated or lone inauthentic actors, click farms, trolls, bots and botnets, cyborgs, other forms of manufactured amplification, etc.). Information manipulation is multifaceted and often created in a coordinated manner across different online platforms. It could be observed not only during the campaign, but also on the election day and prior to/during the announcement of results.
Information manipulation has the potential to exploit existing societal polarisation, suppress independent and critical voices, generate confusion among voters, discredit fact-based information and undermine candidates, institutions, and vulnerable groups. Artificially generated content and dissemination may distort the genuineness of public discourse by creating an impression of widespread grassroots support for or opposition to a policy/issue or individual/group
One should distinguish between the information manipulation that is created and shared within a small like-minded group most likely having a limited impact on the electoral process, and the one that has a potential to harm the electoral process.
As identifying manipulated information is time consuming and difficult, the best approach is to first narrow down the content which must be examined by:
- Approach 1: looking at information that has been distributed or spread exponentially, that is with greater reach or interactions than would be normal
- Approach 2: monitoring actors known for spreading manipulated information and then follow the information trail from there
- Approach 3: looking for hashtags or keywords used to push manipulated content.
A mixture of approach 1, 2 and 3 is recommended in an ongoing, iterative process. Identifying information manipulation requires some trial and error with different approaches to see which of them yields the best result. After content has been identified via one of the above approaches, one should then seek to prioritise content for deeper examination by asking “does it matter?”.
Sometimes a post identified as information manipulation may have reached a limited number of people, in relation to others with higher reach. Those should have priority. On the other hand, sometimes a large number of smaller reaching posts may also have influence on the election. Combining the 3 approaches above is the best way to try to account for all those possibilities.
To identify potentially relevant cases, SMAs can combine three approaches: (1) focusing on content that spreads far beyond normal reach and interactions; (2) monitoring actors already known for spreading manipulated information; and (3) using targeted keyword or hashtag searches to surface narratives of concern. Detailed guidance on how to operationalise these approaches is provided in Phase 2 and in the ‘Content Manipulation’ and ‘Platform / Algorithmic Manipulation’ chapters of the Analysis and Research section.
4 - Hate Speech and Hateful Content
The identification of instances and volume of Derogatory Speech and/or Hateful Content (see Glossary) during the election is one of the areas of assessment for the social media monitoring project. In this area, the focus is on online content that attacks, demeans or excludes people because of who they are, especially on the basis of protected grounds such as religion or belief, ethnicity, nationality, race, language, gender, sexual orientation, disability or other identity factors.
The aim of this area is not to label all harsh or offensive political debate as “hate speech”, but to systematically capture identity-based derogatory or hateful content that may affect equality, participation, or safety in the electoral process. Content that is hostile but not identity-based may still be relevant for the mission, but is normally analysed under other chapters (e.g. negative campaigning, defamation, information manipulation).
The research on this subject can be carried out in a way similar to the Information Manipulation section, with 3 different approaches:
- Approach A: Monitoring hateful keywords – Identify instances of derogatory speech and/or hateful content via the keywords and/or hashtags that are used
- Approach B: Monitoring potential perpetrators, whether those are official candidate/party accounts or external hate communities
- Approach C: Monitoring specific candidates who may be targets of online hate to identify instances of Derogatory Speech and Hateful Content via comments and mentions (e.g., women, minorities, LGBT+, etc)
Based on political context and team capacity, choose the most appropriate method. You will already likely be monitoring candidates and parties, which will only require you to add an additional layer of analysis. Although, if feasible, monitoring hate communities perpetuating hate can provide an early warning for new hashtags or terms. In many countries, these communities exist on niche platforms, which are more difficult to monitor. Consider if the benefits of monitoring niche platforms outweigh the required manual work of shooting in the dark to identify perpetrators. Some factors to consider are if they could provide a worthwhile early warning for your monitoring or influence a significant portion of the population.
As usual, a combination of the 3 approaches may provide the best results.
|
|
Monitoring hateful keywords |
Monitoring candidates or parties for hate |
Monitoring hate communities |
Monitoring vulnerable targets of hate |
How |
Keyword search to identify posts which can be qualitatively and quantitatively analysed |
Monitoring of posts by official candidate and party accounts followed by qualitative and quantitative analysis. |
First identify actors in the hate community. Then, monitor those actors on an ongoing basis collecting posts and carrying out analysis. |
First identify 2-3 worthwhile targets. Then, monitor mentions of individuals using a keyword search and/or comments on that person’s social media accounts. |
Challenge |
This approach only works well for text-based platforms, like Facebook or Twitter. It will be less efficient to capture hate in images or videos. |
If you conclude an actual party or candidate post constitutes “hate”, this is highly relevant for the election observation. |
The challenge here is first identifying the “seed account to monitor”. Consider pre-monitoring using searches to create your list of relevant accounts. This may be time consuming, but tends to be fruitful. |
Depending on the tool used to collect the data and on the social media platform, comments may not be available for collection. |
The analytical framework for this area combines who is targeted (protected ground) with how they are attacked (type of expression), while the seriousness of each case is interpreted using the cross-cutting variables on online impact and potential to harm described in Phase 3. For detailed methods on identifying and analysing derogatory and hateful content, including lexicon building, monitoring perpetrators and targets, and coding examples, see the “Derogatory Speech and/or Hateful Content” chapter in the Online campaign: Analysis & Research section.
Monitoring and Collecting Data
Implement lists and queries on a social listening tool
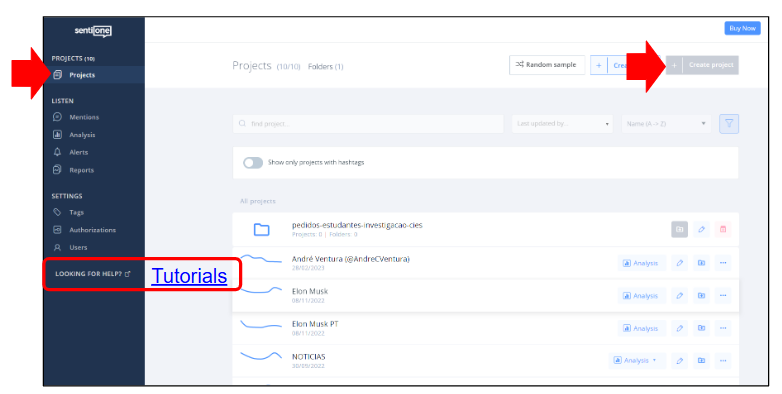
Most social media listening tools allow the implementation of lists or queries for monitoring content on social media. And, although each tool is different in the way that is done, the process is similar. In this tutorial we will use SentiOne Listen to exemplify the process of implementing lists and queries to monitor content on social media.
Implement lists on SentiOne
After you have registered and have access to a SentiOne Listen account, you can begin to compose a list of social media accounts on SentiOne by using the “Create Project” button. You can create a list for 10, 20, 30 or more accounts. Each project should correspond to a list for monitoring, but you can also monitor a single account, if that is what you want to track. If you have doubts on how to implement lists, please refer to the SentiOne tutorials on the "LOOKING FOR HELP?" menu.
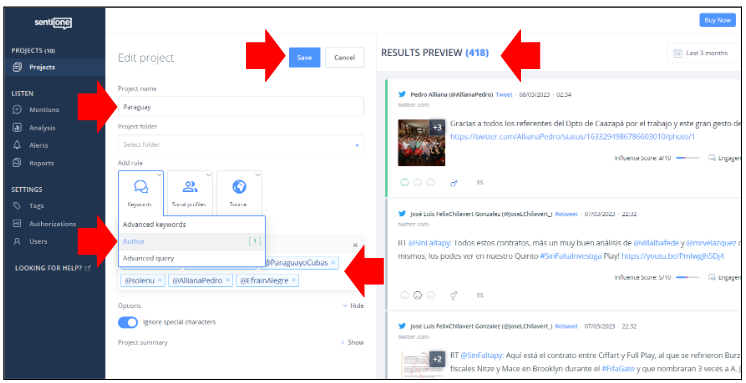
To implement a list on SentiOne proceed as follows:
- While in the "Projects" tab, click on "Create Project" and choose the option "Advanced"
- Then, hover to "Author" and enter the user name of the accounts that you want to monitor
- Check if the preview results on the right correspond to those accounts
- If so, give a name to the Project and save it
- You will be automatically redirected to the "Mentions" tab, where all your results will appear.
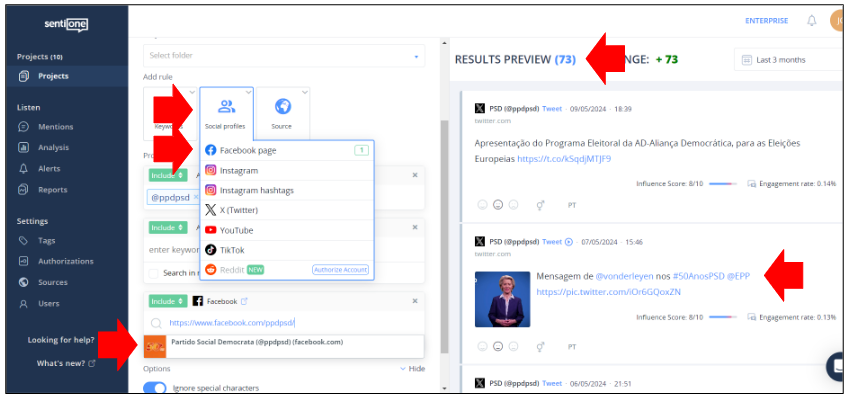
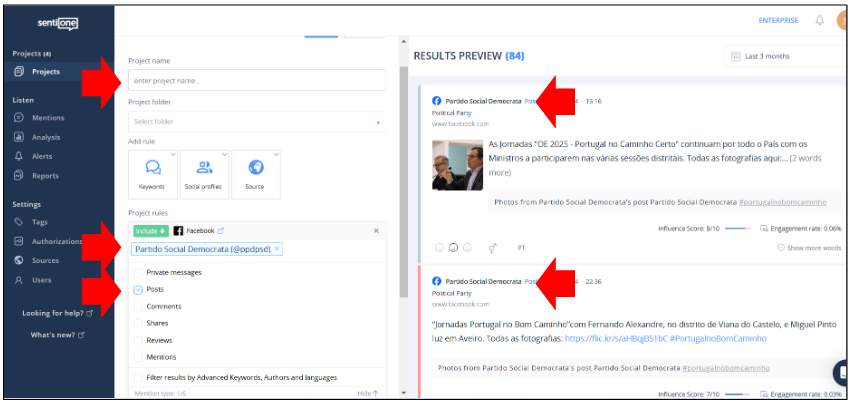
You can also implement lists on SentiOne using the "Social Profiles" function. To do so:
- While in the "Projects" tab, click on "Create Project" and choose the option "Advanced";
- Click on "Social Profile" and then choose the social media platform you want to monitor;
- Input the username or URL of the social media account you want to monitor and click on it when it appears. In this case you want just the posts published by that account, so use the drop-down menu to exclude comments, mentions and messages;
- Check the results preview to see if you're getting what is expected. If so, give a name to the Project and save it;
- You will be redirected to the "Mentions" tab, where all your results will appear.
When exploring social media pages and accounts to monitor on SentiOne, remember that this tool, like most other social media listening tools, only collects data from public sources, which may mean that some private accounts may not be trackable. In particular, Facebook pages and public groups will be available, but personal profiles may not, even if they are public and/or verified.
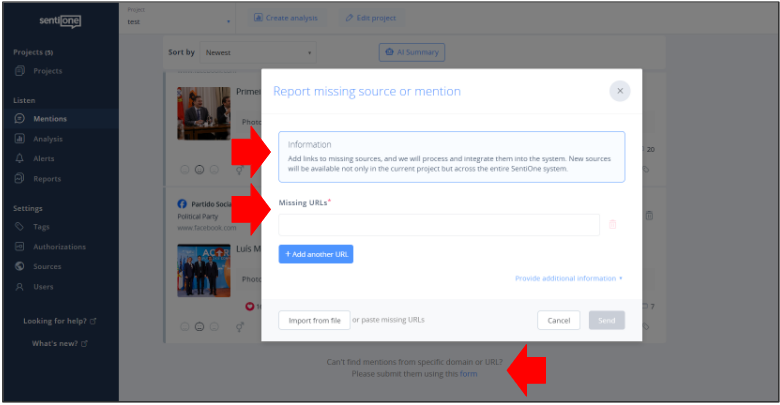
If you find social media accounts or social media posts that are not being tracked by SentiOne and should be, according to the rules above, you can and should report that lack of coverage to SentiOne support or use the specific reporting form that you can find at the bottom of the "Mentions" tab.
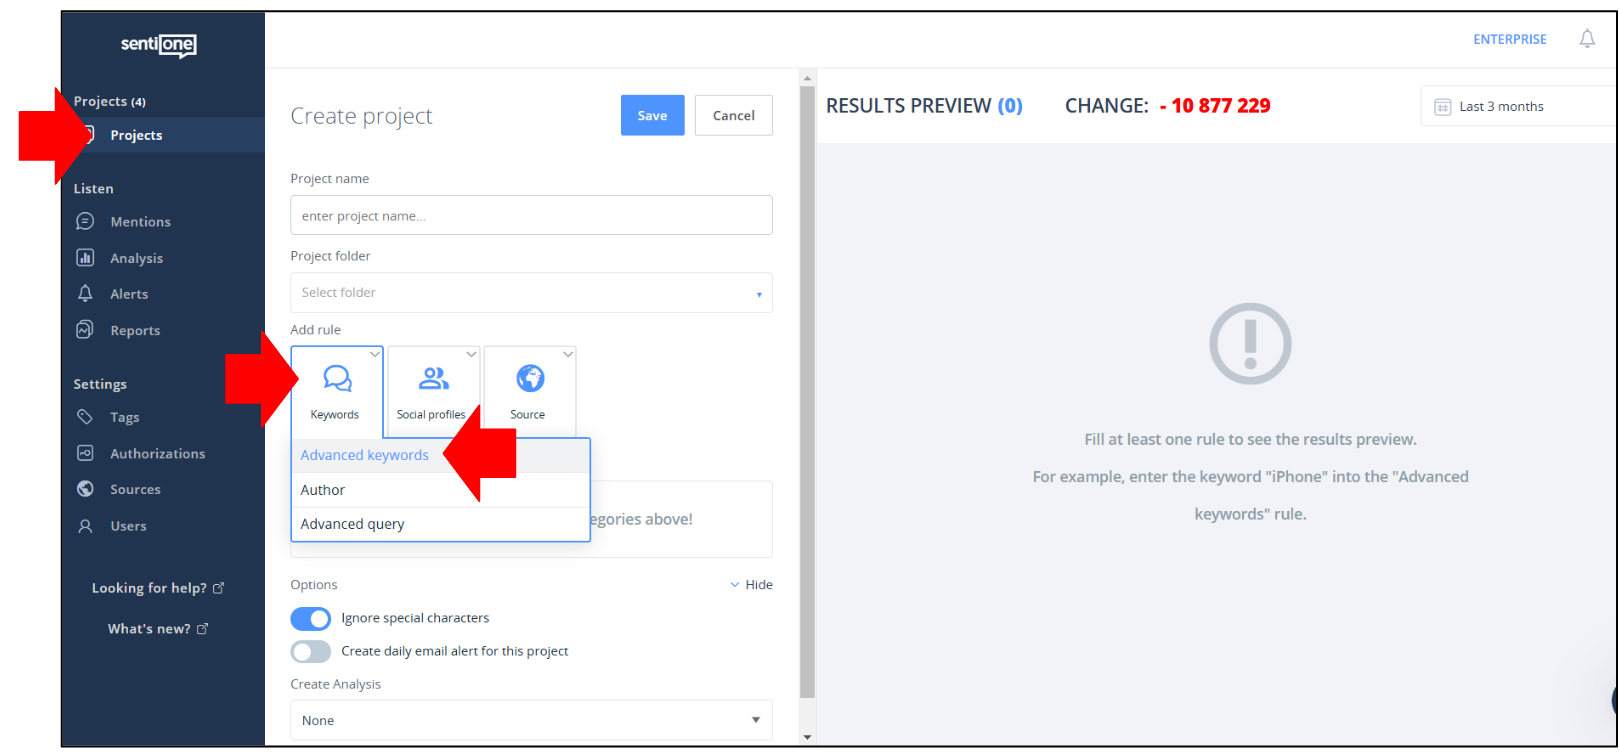
Implement queries on SentiOne
After you have registered and have access to a SentiOne Listen account, you can begin to compose a query on SentiOne by using the “Create Project” button. Remember that, whereas a list is to collect content only from the social media accounts that you select to be part of that list, a query is going to collect all the public social media posts that include the keywords that compose that query. If you want to track more than one query, each query should correspond to its own project. Best practices include composing one query for keywords directly related to the election (usually the names of the candidates are a good starting point) and one or two queries for keywords related to divisive and polarizing issues in the country. If you have doubts on how to implement queries on SentiOne, please refer to SentiOne tutorials on the "LOOKING FOR HELP?" menu.
To implement a query on SentiOne proceed as follows:
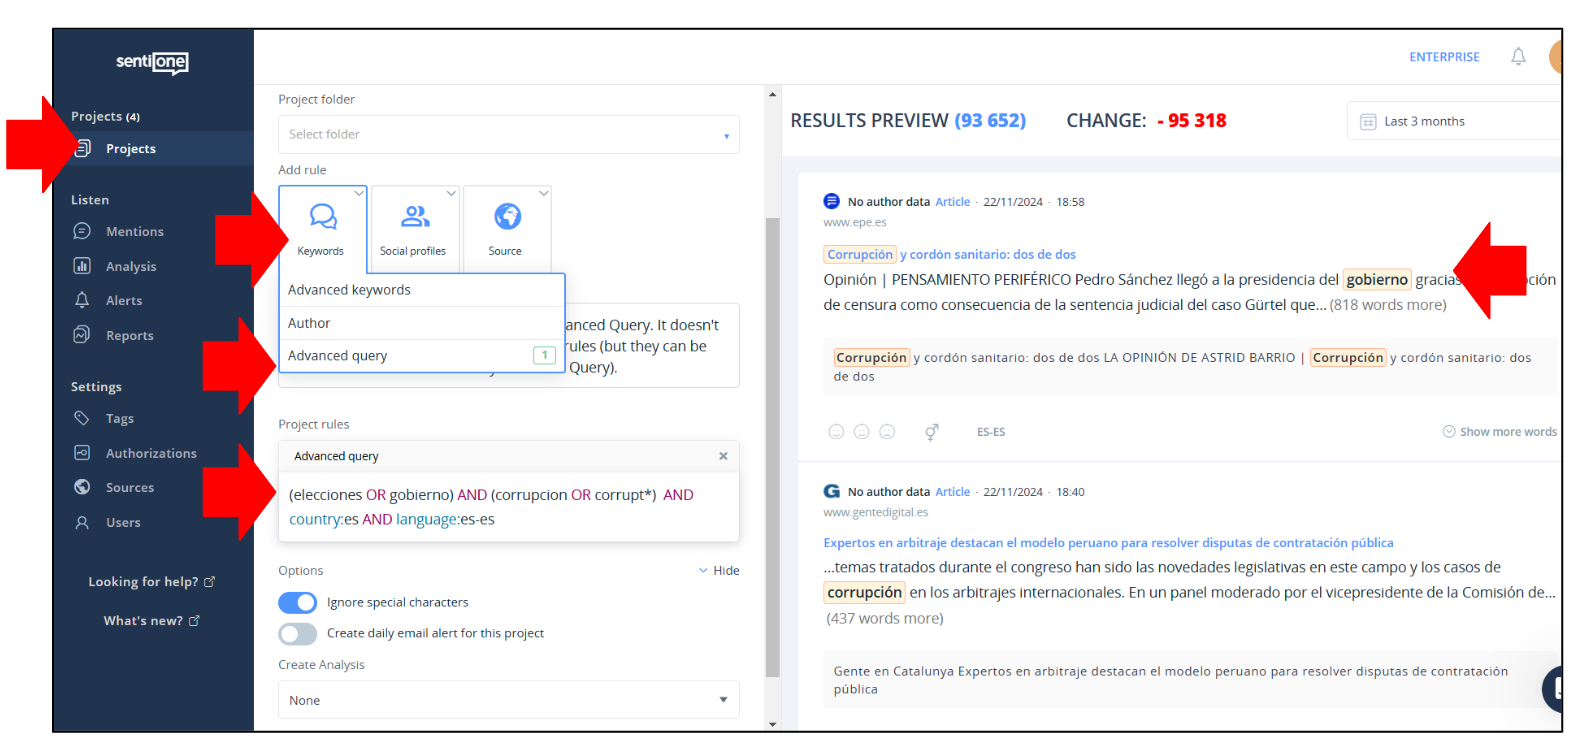
- While in the "Projects" tab, click on "Create Project" and choose the option "Advanced";
- Then, hover to the "Keywords" button and choose "Advanced Keywords";
- Insert one of the keywords in your query, press enter and verify in the preview if the results correspond to what you expected from that keyword. Pay special attention to see if the keyword is returning too many "false positives". If that is the case you should choose another keyword or refine it using search operators (see below)
- Repeat the process for your other keywords;
- If it is necessary to restrict the collection of posts to a given country or language, you can use the "Country" and/or "Language" filters in the "Sources" tab;
- Once the query is complete, save the Project. You will be automatically redirected to the "Mentions" tab, where all your results will appear.
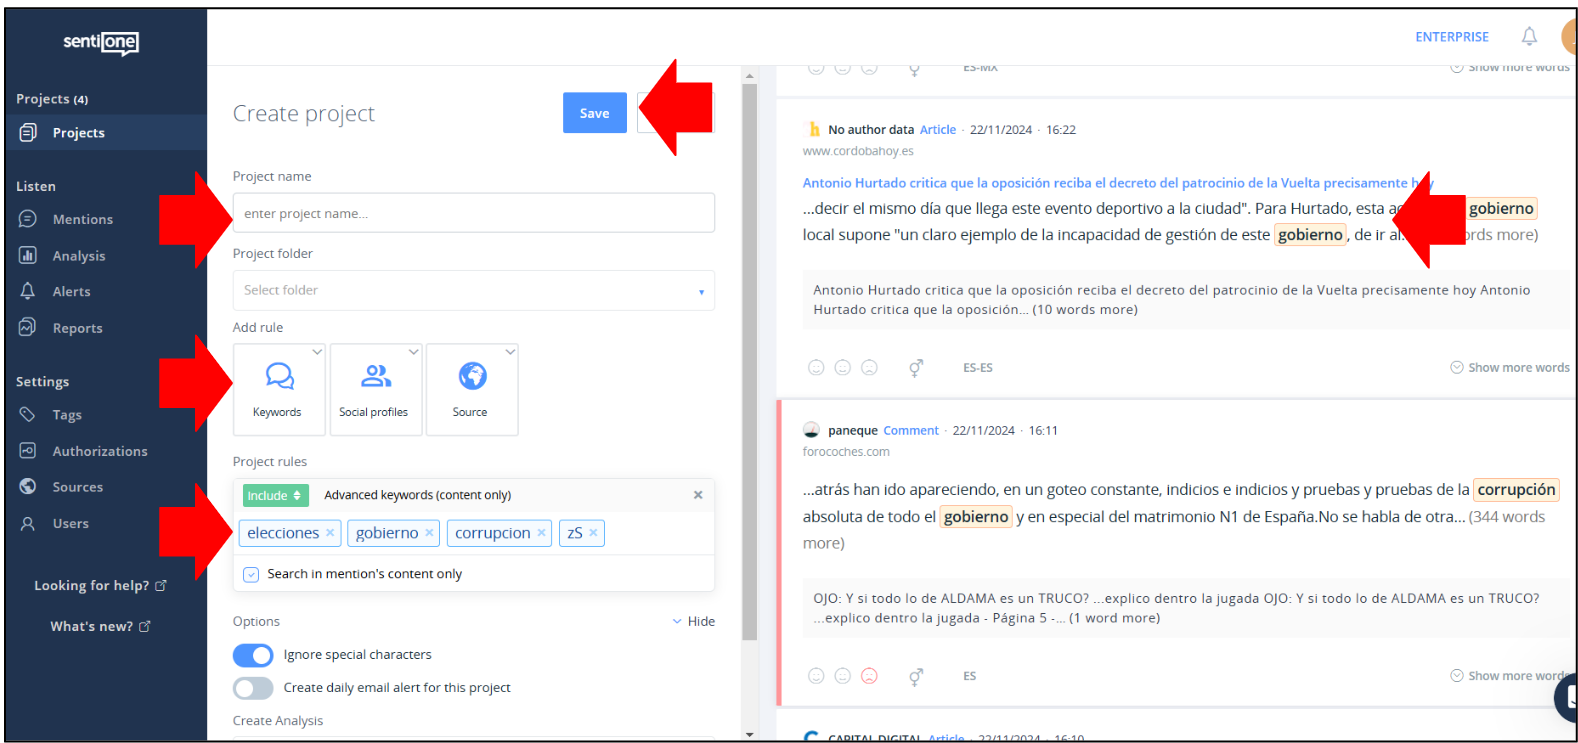
If your search is returning too many “false positives” (which is usually the case in the irst attempts at search) and you feel you need to refine your search query, you can use boolean search operators to better filter your search. If that is the case, proceed as follows:
- Hovering over the "Keywords" button, choose "Advanced Query" instead of "Advanced Keywords";
- Click on "Keywords" but then choose "Advanced Query" instead;
- Input the query that you want to use (an articulated set of keywords joined by search operators) and verify the results. You can see which search operators you can use in the help section of SentiOne. Like before, verify if your query is returning too many "false positives" and, if so, consider refining it further;
- If not, give a name to the Project and save it;
- You will be automatically redirected to the "Mentions" tab
Collect data from SentiOne
After you have implemented lists and queries on SentiOne, and after you have assessed that the data is returning the results which should be expected, it's time to proceed to collect the data. Usually this is done on a weekly cycle (established according to the election campaign cycle), but data can be collected and analysed on longer or shorter cycles to provide context relative to specific days (as, for example, for campaign silence and election days).
The data collected by SentiOne can be downloaded via two buttons at the bottom of the "Mentions" tab, one for XLS format (for Microsoft Excel) and another for CSV format (adequate for opening in several tools, including in Google Drive). Choose the format that suits better the environment where you will work with the data (Microsoft, Google or other).
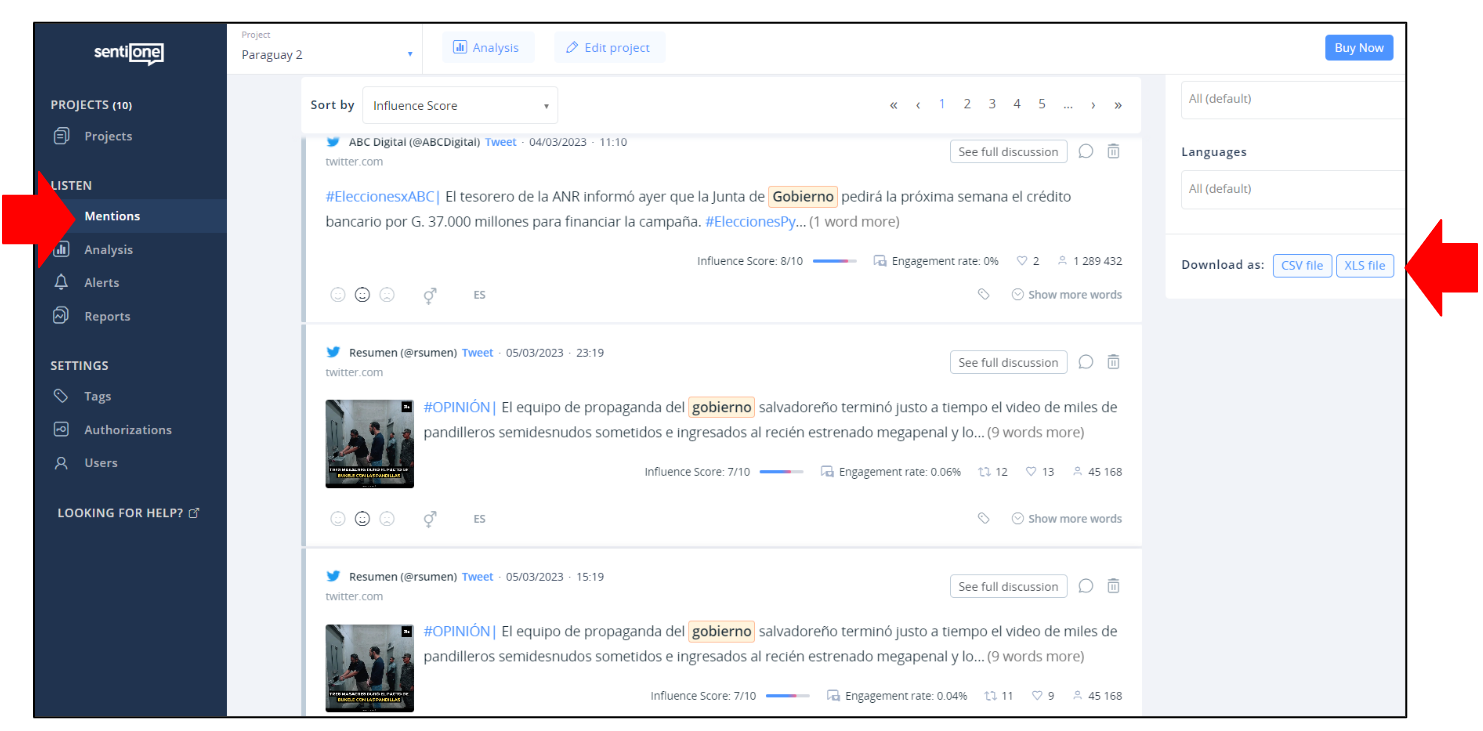
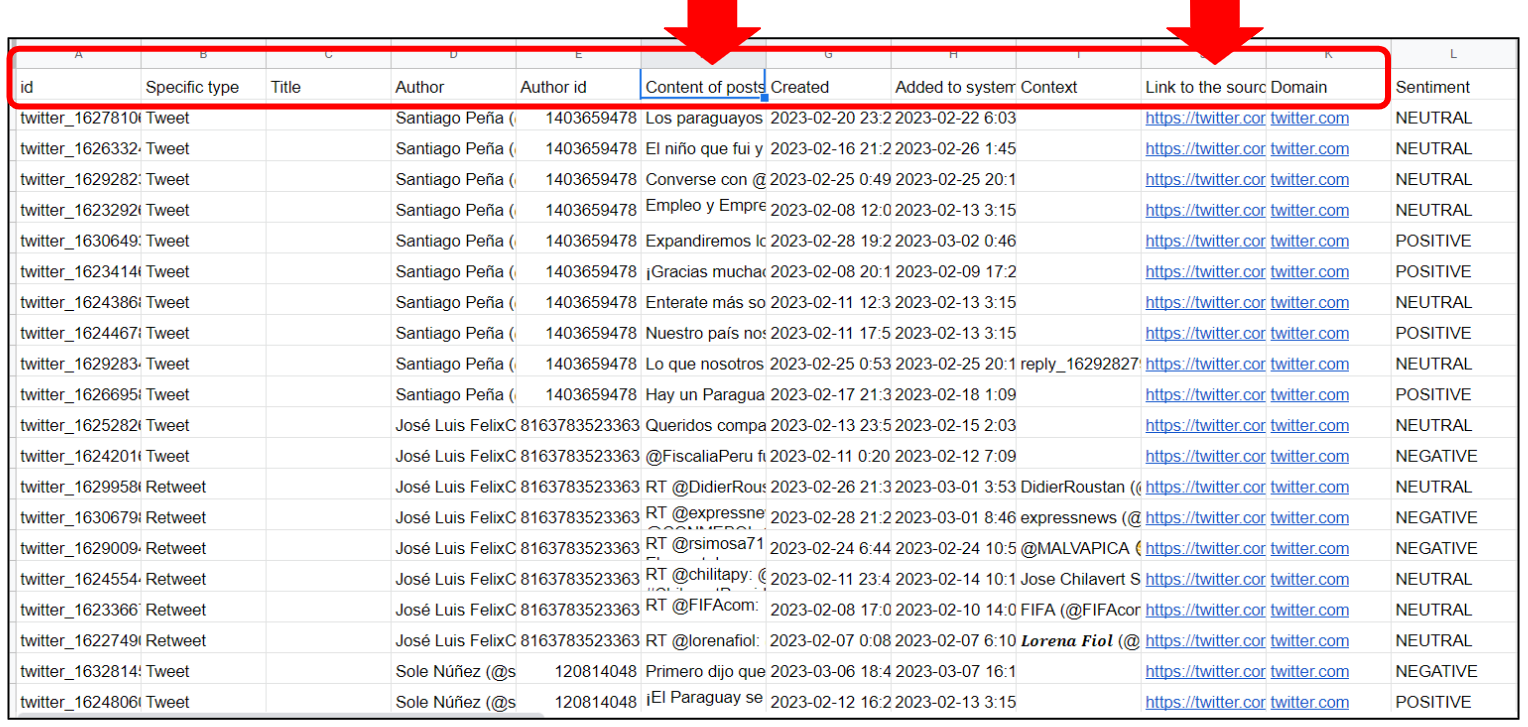
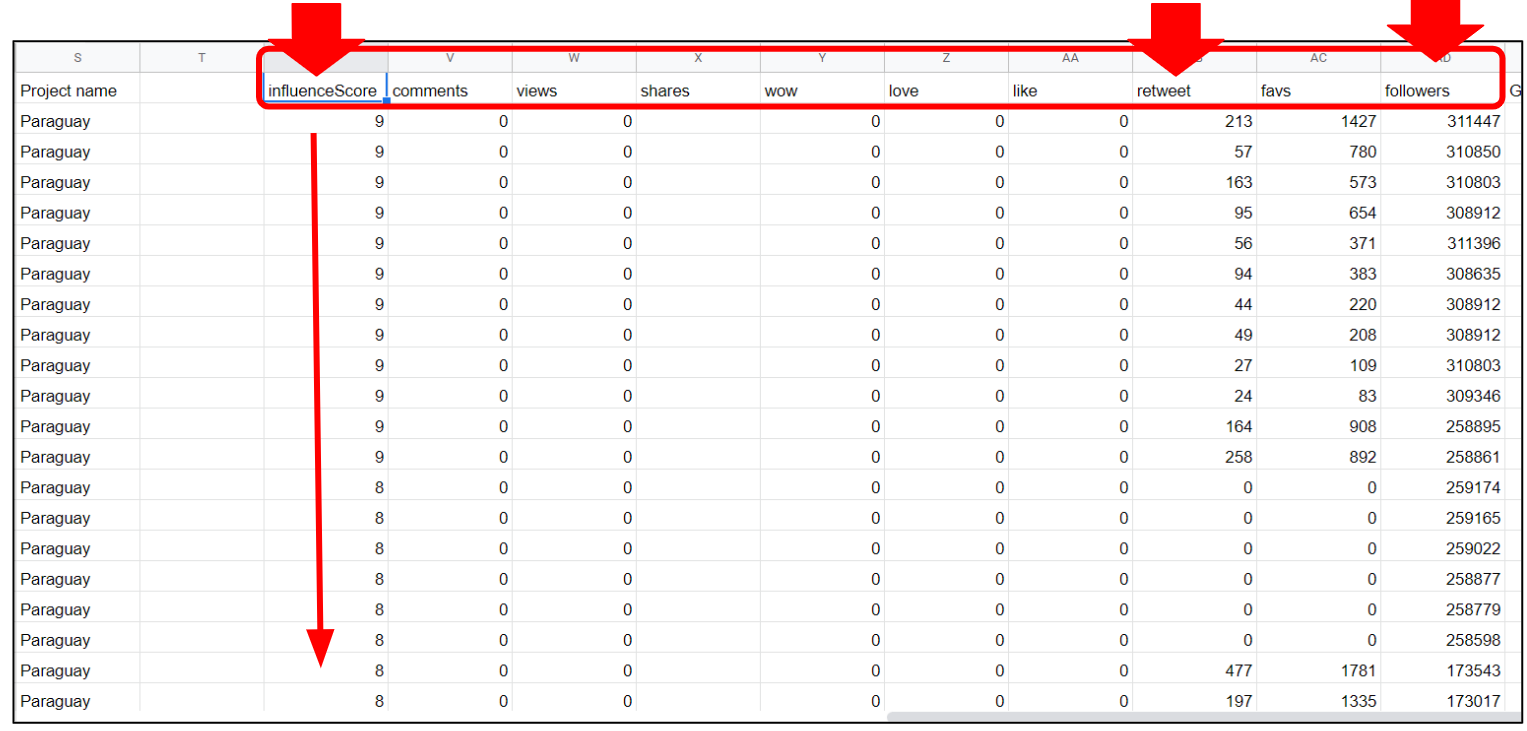
Whatever the social media platform from which you are collecting data and if it comes from a list or a query, the columns of the XLS ort CSV file will be the same and may be ordered by date or "Influence Score" (an internal composed metric that combines how many times a mention has been viewed and shared, and how likely it is that has been seen). In the example below, each line corresponds to a post and each column to a data point about that post (author, content, date, link to the original, metrics etc). The data is ordered by "Influence Score" but can be reordered by any other criteria, namely by any other of the metrics available for the posts.
Online political Advertising Tools
Track election ads on Meta and Google (if available)
Political advertising is one of the areas of assessment for Election Observation Missions. However, the tools to research and monitor online political advertising are limited and full information is not always available in a systematic and/or quantitative manner. Therefore, social media analysts may have to work with the information that is available. As of today, only Meta and Google provide systematic public dashboards and APIs for the disclosure of social and political advertising. Meta provides information about ads displayed in Facebook, Instagram and Facebook Audience Network; and Google provides information about ads displayed in Google (search and display network) as well as YouTube.
To track online political ads by official candidate or party accounts, the suggested method is to search for its official accounts on the available dashboards and compose a list, just as you did for social media monitoring. The dashboards that may have information available are the following:
To track online political ad usage by non-contestants or third-parties, the suggested method is to search for keywords or for the advertiser name, but that search functionality is only available on Meta Ad Library and Ad Library API. Neither the Meta Ad Library Report or the Google Ad Transparency Center offer keyword search functionality. That means you can only track political ads using the list method if you previously know which are the non-contestants that you wish to monitor or if you find them when searching. Local stakeholders may help in this.
Given these limitations, the suggested template for analysing political ads in EOMs should proceed in 4 steps:
Step 1 - Check availability in your country
Check if the Meta and Google ad libraries have data for the country that you're researching, assess if there are legal provisions for online political advertising and ask candidates (if available) if they plan on buying online advertising, and if so, on which online platforms.
Step 2 - Develop a list of official candidates and parties + select key contenders
Consider a threshold to limit your list if it is not possible to monitor all in the time period.
Step 3 - Data collection
Choose a subset of ads per party or candidate, potentially those ads with the most reach.
Manually download data per advertiser using Facebook’s Ad Library and Ad LIbrary Report or Google’s Ad Transparency Center.
Use the Facebook Ad Library API for more in-depth and automated analysis, if you can.
Step 4 - Data analysis
Work with the Excel or CSV files that are extracted from the dashboards.
From the Meta Ad Library Report you get aggregated information about the advertisers that were active on a given time period, including the number of ads circulated, the amount spent on those ads and the entity financing them. You can also search for specific advertisers (remember that on Meta the advertisers are the corresponding Facebook pages). If you can't find a specific advertiser that you're searching for, try enlarging the period to "all dates".
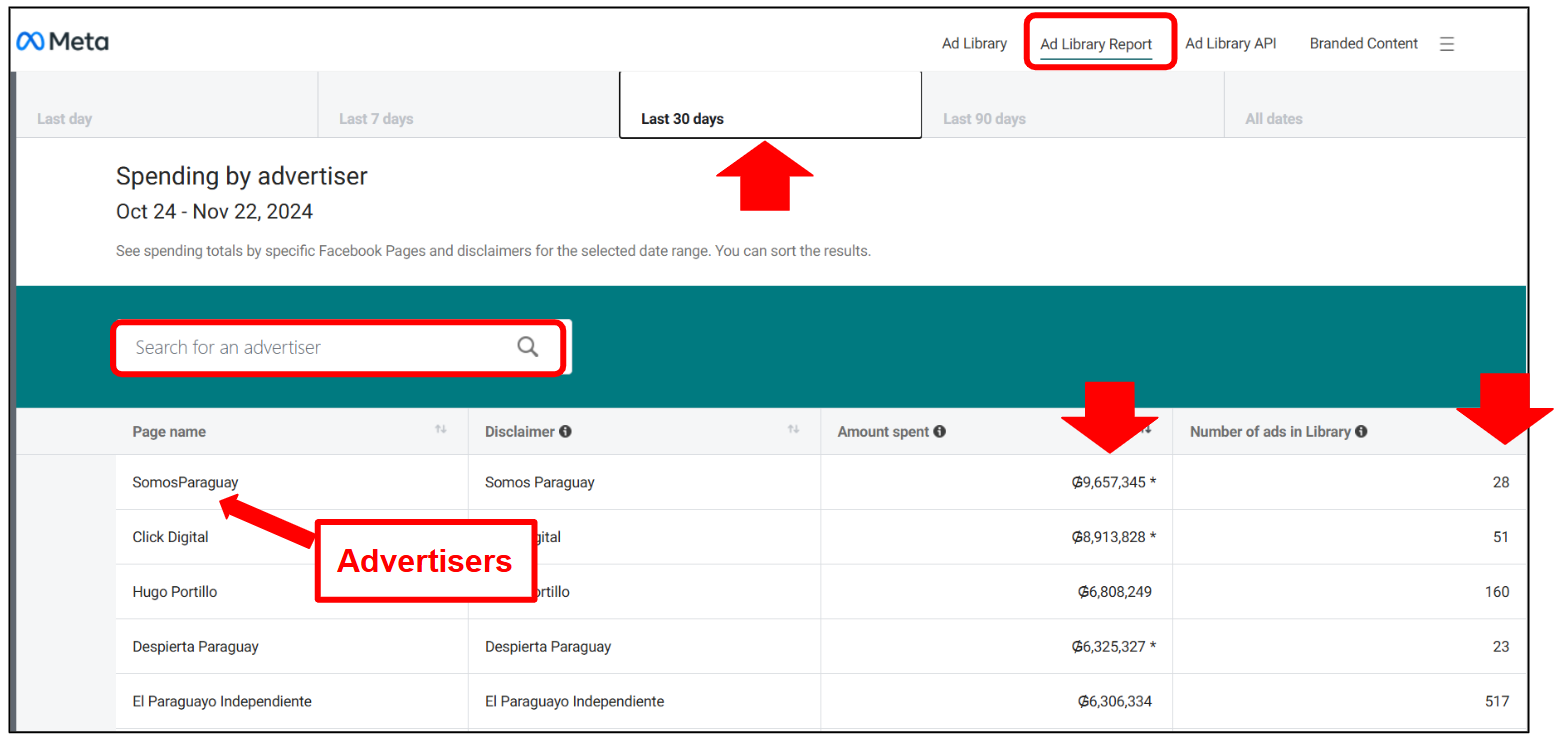
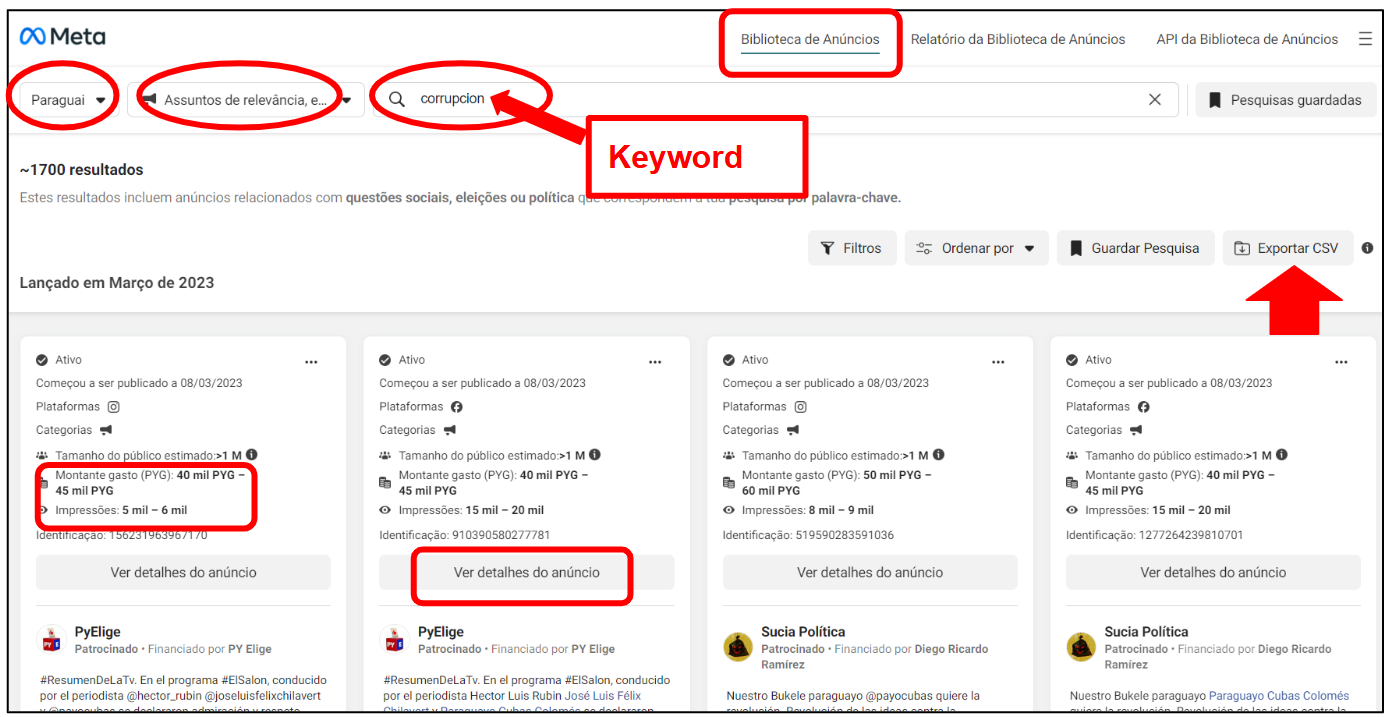
From the Ad LIbrary, you get specific information about each ad (either active or inactive), including the estimated audience, the amount spent (on each ad) and the impressions (views) gathered. As a significant limitation, Ad Library does not provide precise metrics for spending or impressions (views) but rather an interval for each ad (spend between X and Y and impressions also between X and Y). On Ad Library you can see either all ads by a given advertiser or search for ads that include a given keyword. Further details about each ad are also available as well as an option to export the selection as a CSV file.
Aggregated data on advertisers from the Meta Ad Library Report can be downloaded as a Zip file from the bottom of the corresponding page. That Zip file will include a CSV about the advertisers. Opened in Microsoft Excel or Google Sheets, the CSV will display the aggregated data on the advertisers.
Specific data on ads from the Meta Ad Library can be downloaded as a CSV file that will display specific data on the ads, including the relevant metrics regarding impressions (views) and amount spent, both as an interval rather than a precise value.
Also in the case of advertising, the RELEVANCE is given by the number of impressions an ad managed to get, because the higher the number of impressions the greater the number of people that presumably have seen it. In the metrics available for tracking the impact of political ads on social media, that is the best proxy for estimating the attention that a given ad message may have gathered.
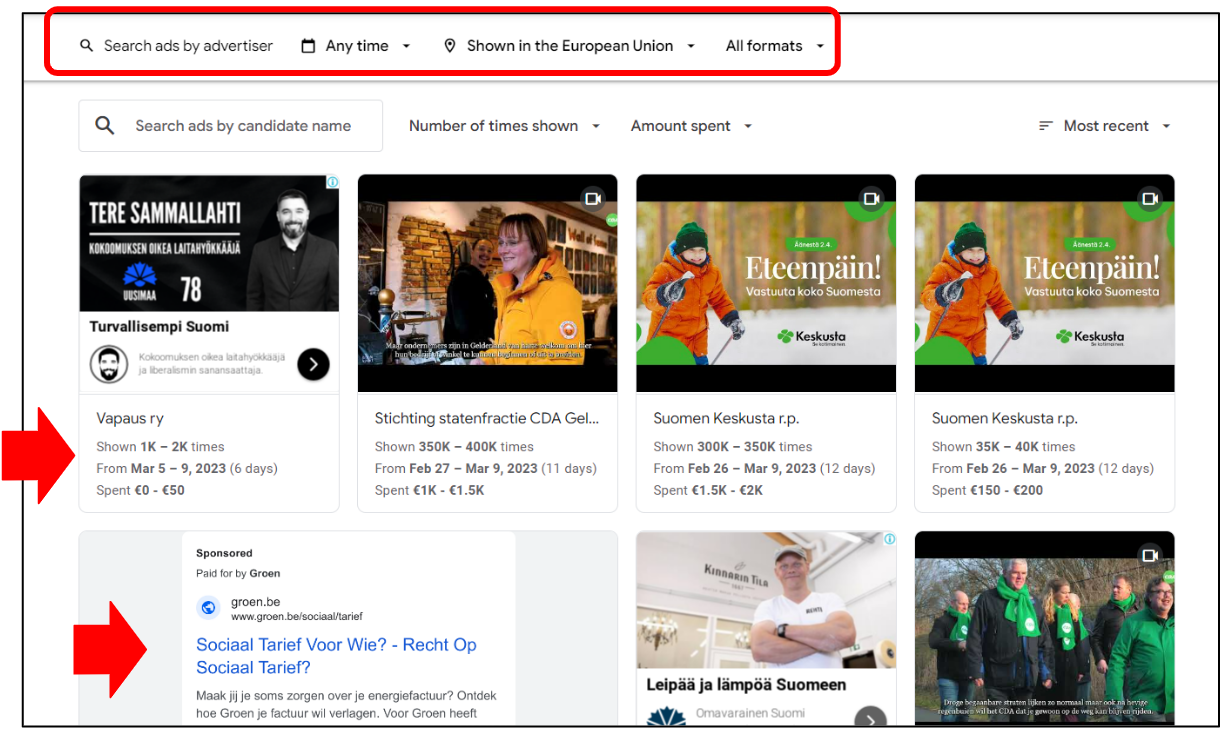
On Google Ads Transparency Center, information about ads circulated on Google (display and search) and YouTube is even more limited. You can:
- Search by advertiser to see total ad spend
- Analyse top keywords, spend per geography, targeting weekly spend, statistics
- View ad creatives by each advertiser
However, Google Ads Transparency Center also includes some limitations that are very relevant for the research:
- Limited data available (same as on Meta Ad Library, no precise values are given, just an interval of amount spent and impressions);
- Data on political ads available only for a very limited number of countries (currently Argentina, Australia, Brazil, Chile, United States, Israel, Mexico, New Zealand, United Kingdom, Taiwan, South Africa, India and all countries of the European Union;
- No clear indication for which ads were posted on YouTube or Google.
To track election ads on Google, you should look for advertisers corresponding to the lists that you are monitoring and track their ads on Goolge Ads Transparency Center. On this dashboard only aggregated data will be able to be downloaded, which means that data on specific ads (namely impressions and spending intervals) can be visible here, but will have to be manually collected, if necessary.
Given the limited data available, tracking online advertising in EOMs will have to resort to a combination of the quantitative data that is in fact available with the qualitative assessment resulting from consultations with local stakeholders on advertising strategies developed by the candidates or by the non-contestants publishing ads about the election.
Steps by area of assessment
Online Campaigning
Step 1 - Sample Selection – Define your lists of candidates and parties
First, you will need to come up with a general list of all candidates and parties that you would like to monitor. Consult lists of registered contestants from the electoral commission.
There is a high chance that you will need to limit your list to the top candidates and parties due to time constraints. For example, you may want to pick parties that maintain a large share of representation in the current parliament above a specific threshold. At the same time, you may want to consider if certain parties or candidates have shown a history of harmful online behaviour. Any decision on threshold should be clearly explained to report readers.
Second, you will need to define a timeframe relevant to the online campaign period. There may or may not be an official campaign period. It may also be worth monitoring after election-day to identify false claims regarding the election’s credibility, and results acceptance.
Third, depending on your data collection tool, you may need to find the exact social media handle per party and candidate. Determine if this step is necessary after identifying which data collection tool(s) you will use. Note this can be a time-consuming process, especially if you are looking at many actors.
Step 2 - Data Collection – Gather social media posts from the candidate and party accounts
Using the lists of actors from Step 1, you can start to gather all the social media posts from the selected candidates and party accounts. See Methodological frameworks section for guidance on how to collect data. Consider weekly data collection intervals so team members can label posts simultaneously to collection if relevant per step 3.
Step 3 - Data Analysis – Analyse the social media posts from the candidate and party accounts
|
|
Research question |
Means of analysis |
|
Question 1 (Easiest) |
Which party or candidate used social media the most for their online campaigning? |
Count the total number of posts per candidate and party. |
|
Question 2 |
Which social media platform did parties or platforms use the most during the campaign? |
Count the total number of posts per candidate and party per social media platform. |
|
Question 3 |
Which party or candidate did users engage with most on social media platforms? |
Count the total number of likes and shares per candidate and party (potentially by platform too). |
|
Question 4 |
Did parties or candidates use negative or positive campaigning techniques? |
Label posts as “negative”, “positive” or “neutral” and count the total posts. |
|
Question 5 |
Which topics did parties and candidates discuss during the campaign? |
Label posts by topic and count the total posts. |
|
Question 6 (Hardest) |
Did parties or candidates make false claims about the election or spread Derogatory Speech and Hateful Content using their official accounts? |
Label posts by the respective category and count total posts. |
Some online tools for monitoring, collecting and analysing data offer the possibility of tagging or labelling social media publications according to previously defined categories. If so, that may be useful for the analysis. The categorization of the social media posts by candidiates and parties is described in the Monitoring Projects section. First, you should create a list of potential topics. Sometimes there are already useful websites for a given country that include the top political issues. Based on this list and qualitative information, you should limit the number of topics to 10 or so. Using your final list, you can develop a codebook with definitions for each topic and examples. Then you can label each post per topic, and the final data can be summarised and counted to understand the top-level trend.
Political advertising
Step 1 - Check if the tools to monitor political ads are available in the country
This step is important to decide if it is even possible to carry out analysis in this area of assessment.
- Facebook/Instagram: Meta Ad Library (search by keywords) and Meta Ad Library Report (search by advertiser)
- Google/YouTube: Political Ads Transparency Report (search by advertiser)
Step 2 - Develop your list of official candidates and parties
For this area of assessment, you will be monitoring the advertisements made by official candidates and parties. Consider a threshold to limit your list if it is not possible to monitor all within the time period.
Step 3 - Data collection
See Methodological Frameworks section for more information regarding the Meta Ad Library, Meta Ad Library Report, Meta Ad Library API and Google Political Ads Transparency report. Search for candidates and parties as “keywords” rather than by official accounts. Label and quantify posts campaigning for and against the candidate.
Non-programming (Facebook/Instagram and Google/YouTube)
Manually download data per advertiser using Facebook’s Ad Library report or Google’s Political Ad Transparency Report. Consider which intervals are relevant given time bucketing issues for some tools.
Programming Advanced Method (Facebook/Instagram)
If it is possible to use the Facebook Ad Library API, your analysis can go into more depth.
Take into account the limitations of the data collection from ad repositories:
- Facebook Ad Library is not available in every country
- Facebook Ad Library Report only allows to search by specific advertiser and only provides data with predetermined time frames predetermined, which might not align with your intended reporting period
- Google Political Add Transparency Report is also restricted to an even smaller number of countries
- Political Ads Transparency Report does not disaggregate results by Google property, such as YouTube or Google Search, for instance.
- Finally, neither Meta or Google provide precise values for ad impressions and amount spent. The data available expresses only an interval between the higher and lower values.
Step 4 - Data analysis
|
Question 1 (Easier) |
What was the total spend per party or candidate in the monitoring period? |
|
Question 2 |
Were any advertisements posted during electoral silencing periods? |
|
Question 3 |
Which demographics and regions were targeted by each candidate/party? |
|
Question 4 (More complex) |
What messaging did different candidates and parties use in their political ads? |
Generate summary statistics based on the data collected per each question. A challenge will be that data is sometimes available only within predetermined timeframes, which can create difficulties to have statistics corresponding to the desirable timeframe for election analysis.
First, draft a list of different topics or messages. Filter through a few random subsamples of ads per party or candidate to generate this list. Then carry out manual coding and add up the summary statistics. If there are too many ads to monitor, decide to only label posts above a certain threshold. For example, choose a certain number of ads per party of candidate, potentially those ads with the most reach.
Again, lack of available data may be a significant hurdle for the comprehensive assessment of Political Advertising on social media. Therefore, the social media analyst should work as much as possible with the tools available and consult with local stakeholders to "fill in the gaps" and guide the monitoring process. Also, bear in mind that Meta and Google do not exhaust the social media advertising landscape. Other platforms, like Telegram or TikTok, also allow ads, but do not provide a dashboard for the respective accountability. Telegram does not have such a dashboard and TikTok has an Ad Library but claims not allowing political ads (although some political actors have used TikTok influencers to convey their messages). Those approaches cannot be researched in a consistent and objective manner, but should nevertheless be under the radar of the social media analyst.
Identifying information Manipulation
Identifying online information manipulation may feel like searching for something in the dark at first. None of the available tools alone will be sufficient for a fact-based assessment on the presence of bots, trolls, fake accounts, and other manipulation techniques in online campaigns. Therefore, you often need to focus on some cases and conduct a full analysis of data retrieved via manual verification and OSINT tools to identify information manipulation techniques.
Reaching out to local social media analysts or OSINT experts who already work on the topic is highly recommended. They may already have lists of seed accounts for you to monitor or recommended keywords or places to begin your search.
Look for trending and viral content, which may be spreading unexpectedly fast. How much engagement has the content got in comparison to a typical post of this nature? If the tool or tools you are using have some metric to assess the overperformance of a post, try to use that metric. Otherwise, unusually high reach or total interactions may also be an indicator.
If your team has programming capacity, you can use PyCoornet or CooRnet to identify coordinated link sharing behaviour on a large sample of URLs. This is extremely useful to quickly identify any network behaviour for a more comprehensive picture. But note that a qualitative check is always needed when using these tools because coordinated activity can also be used for positive purposes as well, as, for example, when an electoral management body makes an important announcement about the election that is widely shared.
Develop a list of actors known for spreading manipulated information. You can compose this list following an iterative search on key divisive keywords in order to identify the actors that repeatedly and with greater reach address those key divisive issues. It may also be useful to look in the comments sections of known actors to identify actors that may be consistently spreading manipulated information.
The challenge with this approach is to have a transparent and consistent method to identify such actors known for spreading information manipulation. If that is not the case, the neutrality of the research may come to be questioned. Being transparent about the method used to identify those actors and about why they were identified is paramount to prevent that.
Look for hashtags or keywords used to push manipulated content. This approach leverages the fact that to spread information, the content creator must enable it to be found. Knowing the often “coded” vocabulary of troublesome movements or ideologies is useful here. For example, the use of polarising or divisive terms or language tends to be associated with manipulated content. If you follow those terms or language, you will be closer to identifying that kind of manipulated content.
Analysing information manipulation
If content is assessed to have received more engagement than expected, has been shared in diverse environments (i.e., groups), and has spread to different outlets (i.e., platforms), then it can have an impact on opinions and thus elections. This may be a useful threshold to consider when narrowing down your sample of posts to analyse from the previous section.
Analysts may then choose to investigate that content further using OSInt practices. They may also decide to code content for specific narratives to draw top-level conclusions (guidance on how to develop and use a codebook are also described in the Monitoring Projects section). It may be possible to draw some conclusions about the type of actors spreading such content (e.g., gossip pages, groups favouring a certain party); however, analysts should ensure their data or investigation is conclusive before quoting it in the reports. Remember that your analysis should always result from consistent, objective and transparent criteria.
Investigate suspicious accounts. Is the content being shared via suspicious groups? Checking the group’s history can also indicate if the group may have been setup only for spreading disinformation. Changes in admins, group name, creation date, and unusual follow/member demographics should all be checked.
Programming helps here, but some of this can be gathered manually, especially unusual follow/member demographics. Account or group names will often, although not systematically, indicate their character, e.g. their political leaning. Also, examine groups/accounts for shared administrators, followers or members to determine if they form a community.
While researching for information manipulation Datajouralism.com guides on Investigating Social Media Accounts and Spotting bots, cyborgs and inauthentic activity may prove useful.
Verifying specific posts may be necessary in your monitoring, although it will be time consuming to carry out a thoughtful, solid investigation into many posts. Consider testing average time required for your team to investigate a post to determine a realistic sample size for this area of assessment. See some useful resources:
- Bellingcat’s Beginner’s Guide to Social Media Verification
- Deutsche Welle’s curated guide to fact-checking and resources
- DRI’s Guide to image and video-based social media
- Also, check out the "Useful Resources" section in this Toolkit
Consider how many people have actually engaged with the content. If you find that a post is sharing false or misleading information, it would be important to know how many people that information may have reached. If it only reached 1 person, the potential harm of such content is less than if it had reached 1 million people. You can check metrics about the posts - namely reach and/or interactions - to try to assess how much attention that post has garnered. This information is also available in the .csv files you are collecting.
Understanding common narratives and tactical shifts is highly interesting. However, this method will require manual coding of a selected sample of false or misleading posts. If you are already planning on manually coding a selection of posts as false or misleading, this would be an easy and highly useful element to add to your analysis.
Create a list of false or misleading narratives based on qualitative research and a first review of false posts. From this, make a coding guide with clear definitions and examples for each category. Label posts accordingly and add more narratives to your master list as they come up. You may want to include specific categories for false information that specifically target electoral integrity. It may be useful to consider CT members such as Political Analyst and Election Analyst and social media companies’ policies when defining your categories.
For this, it may be useful to take some inspiration from the election policies set up by social media platforms to moderate content online, like these examples:
Once the posts are labelled, analyse top level summary statistics to understand which narratives were most important. Furthermore, how did the narrative shift over the campaigning period? Are there any feedback loops between niche accounts spreading such narratives and mainstream actors?
In order to identify and analyse information manipulation, try to follow these practical tips for guidance:
- Instead of tracking all the posts in one given social media platform, track only the most relevant. Those will most probably include disinformation content that may be relevant in the electoral process.
- Identify the narratives that, in each country, are more divisive and polarising. Those narratives may lead to information manipulation activities and/or derogatory speech and hateful content.
- It is not as important to focus on attribution (“the who”) as it is to explore the impact of the narrative on the electoral process (“the how”).
- Use monitored lists to identify repeated images, videos or narratives that can lead to coordinated inauthentic behaviour networks.
- When performing in-depth research on whether a post contains disinformation or misleading content, consider checking with local fact-checking agencies or searching fact-checking search engines.
- For more advanced search, use OSINT tools.
Derogatory Speech and/or Hateful Content
Step 1 - Define relevant keywords and actors
Your Derogatory Speech and Hateful Content lexicon should be made up of inflammatory language, particularly terms that could be used to target vulnerable populations. This list should be as widely encompassing as possible to gather many posts that can be analysed in a more refined way later. This process may be carried out through brainstorming with the local team and online research. But take into consideration that some SMM teams may be uncomfortable discussing hate speech and the associated vocabulary.
You may have an initial list, which may be searched to identify further language commonly used alongside the keywords that have been already identified (in a snowball strategy, as referred in the Methodological Frameworks section). As the mission goes on, keywords and hashtags will most probably evolve during the course of the mission to reflect the different stages of the electoral preparations (from voter registration to tabulation and announcement of results), and to reflect the political events taking place in the country (rallies, speeches, incidents, arrests, protests, etc.).
The social media analyst will consequently run searches with those hashtags and keywords with the tools he/she uses, selecting the timespan, accounts, their geographical relevance, etc. Social media listening tools offer the possibility to “save searches” or create “projects” based on the selected keywords and hashtags.
Often Derogatory Speech and Hateful Content lexicons already exist for a given country. A Google search will be the best place to start. You may also find it helpful to get in touch with researchers, civil society or academics who have developed these lists or worked on this kind of monitoring before.
Step 2 - Data collection
While it is possible to use a keyword-based lexicon approach for text-based platforms such as Facebook and Twitter, for YouTube, Instagram or TikTok, any keyword-based search will produce weaker results because the content is video or image, not text.
On the other hand, it is likely that hateful or derogatory posts will be deleted by social media platforms, so it’s important to take screenshots of images and save post data in real time or use some archiving tool (see Tools & Techniques section). Likewise, most data extracted from social listening tools will carry all the information public at the date of extraction, but not the images. If an image is relevant for the analysis of Derogatory Speech and Hateful Content, taking screenshots or download images would be advisable. The same with video: if a given video may be important for the analysis, it should be downloaded and archived.
Step 3 - Data analysis
How do you analyse your collected social media posts that are using the inflammatory or derogatory terms from your lexicon? If you're collecting data from social media, you can categorize certain pieces of content as derogatory or hateful and sub-categorize them according to further criteria:
- Targets: Who is the target of this Derogatory Speech and Hateful Content?
First, create a list of vulnerable populations. Then manually sort through posts labelling each post per group. Summarise the results to understand which population was most targeted. If programming skills are available, automatically filter through posts to label each one with the appropriate target group.
- Narratives: What are the common narratives perpetrated against targets?
Based on a qualitative analysis of some initial posts and background political knowledge, draft a list of hate narratives. Then create a codebook with examples.
This manual coding would be carried out in coordination with that of “Targets” above, on a weekly basis and according to the capacity of the team.
- Spread and traction: How is this content spreading and how many people are exposed? What could be the impact on election integrity, including participation?
Calculate summary statistics on total interactions for election-related posts identified as derogatory or hateful. It is interesting to understand how many potential people may have received such inflammatory or derogatory messages. Also, how is this content spreading across platforms, if at all? This point helps answer the “so what” or impact on the online community.
- Top perpetrators: Who is spreading hate and are they part of a larger hate network?
The easiest analysis that you can carry out is simply checking the top accounts who posted using language in your lexicon. Is there a network of hate or are actors acting on their own? Consider investigating if they are sharing content in a coordinated way
Monitoring potential perpetrators
This section presents a method of monitoring perpetrators of hate: official parties or candidate accounts and hate communities. Monitoring official parties or candidate accounts is significantly easier because the actors to monitor are relatively set. In some countries, they may be the most obvious perpetrators of Derogatory Speech and Hateful Content. Hate communities are more difficult to monitor because they are constantly changing and harder to identify. The presented method may be applied to both.
Step 1 - Define your actors to monitor
For parties and candidates, define a list of official accounts to monitor. Consider targeting your monitoring of Derogatory Speech and Hateful Content to those candidates and parties who would be most likely perpetrators to free up more time for other aspects of the monitoring. For hate communities, identifying hate actors may be more difficult. One solution is to track users engaging with the top perpetrators and analyse to which hate communities they adhere.
Step 2 - Data collection
Again, it is likely that posts will be deleted by social media platforms, so it’s important to take screenshots of images and save post data in real time. For parties and candidates, it is likely you will already be collecting social media posts from official candidates and party accounts. If this is the case, you can monitor those same posts for Derogatory Speech and Hateful Content. For hate communities, you will have to engage in a dynamic process of adding more and more actors to your list as you find them.
Step 3 - Data analysis
Label your collected data for Derogatory Speech and Hateful Content by integrating this into your categories and sub-categories. You may also want to label specific narratives or the target of hate. It is also worthwhile to track the total interactions and reach of specific posts to understand their impact. Consider referring to social media platform’s hate policies for examples to include in your Derogatory Speech and Hateful Content codebook. Because of being manual, this method is the most time consuming but may be more precise than advanced tools. It will also allow you to label for specific nuances. If you or your team have programming capacities, it is possible to use code to identify Derogatory Speech and Hateful Content on a large-scale basis. If that is the case, consider using the following tools with Python:
At the moment, there are no social listening tools that can identify Derogatory Speech and Hateful Content and generate immediate data visualisations. Such tools can run preliminary sentiment analysis that can indicate the tone of the conversation. However they are not 100% accurate and reliable, as their analysis depends on the effective performance of the online tool. The built-in sentiment analysis functions of the ready-made tools or software does not allow any of them to accurately detect derogatory speech and hateful content. Such tools might flag potentially problematic posts, but they all would require a manual review. Plus, the machine learning support for this type of algorithmic attribution of sentiment tends to be more proficient in the English language than in other languages, which may be a limitation in the election missions.
Monitoring specific candidates who may be targets of online hate
This method is probably easier given the target is confirmed and it does not require the full development of a Derogatory Speech and Hateful Content lexicon. However, it is the narrowest approach, and does not paint a comprehensive picture of Derogatory Speech and Hateful Content in the general discourse. It may however still show biases in the online discourse if vulnerable candidates are disproportionately targeted.
Step 1 - Identify some potentially vulnerable candidates.
Consider any female and/or minority candidates who would be particularly vulnerable to Derogatory Speech and Hateful Content during an election.
Step 2 - Data collection – collect posts about the candidate and/or comments if possible
Posts about the candidate would be collected via a keyword search for that candidate’s name along with any relevant hashtags. If possible, collecting comments on that candidate’s account would be highly relevant as well. Some social listening tools, can collect comments on Facebook, as well as replies and mentions on Twitter and comments on YouTube.
Step 3 - Data analysis
A sample of posts and/or comments about a potentially vulnerable candidate can be labelled for hate or not. More nuanced categories may be applicable as well, particularly the types of hate or attributes that perpetrators may focus on. See Democracy Reporting International’s guide on monitoring gender-based harassment and bias online for some coding category ideas.
Practical tips for identifying and analysing Derogatory Speech and Hateful Content:
- Consider national law as well as international principles as a reference. Clearly state in the final report the definitions you have used.
- Consider deconstructing “hate speech” into more operational concepts like Derogatory Speech and Hateful Content. Whereas “hate speech” involves assuming the feelings of intentions of the perpetrator, “derogatory speech” and “hateful content” focus solely on the content of the hateful message, independently from the feelings or intention of the perpetrator.
- Vulnerability (of persons and groups that are the object of Derogatory Speech and Hateful Content) could be taken as a criteria.
- Use full quotations when referencing Derogatory Speech and Hateful Content instances in the report, as this will help the reader to assess what you are writing about.
- Discuss with other analysts and local stakeholders what words constitute Derogatory Speech and Hateful Content in the country-specific context. Cultural obstacles with local staff need to be taken into account with respect to using or/and looking for derogatory language. DCO, LA, MA, and SMA will cooperate to draft a reference document for the whole CT as well as for training purposes.
- Consider the relevance of country specific examples in footnotes because political context matters.
- Ensure to include a simplified explanation of how to distinguish between harsh commentary, that is a legitimate form of freedom of expression and Derogatory Speech and Hateful Content.
- Clearly state in the final report the definition you have used giving an explanation in a footnote and the methodology section of the EU EOM Final Report Annex.
- Consider referring to social media platforms policies for examples or as a framework for your coding categories: Facebook hate speech standards; X's hateful conduct policy; YouTube hate speech policy; etc.
EOM/EEM Methodological Framework
Compared to Election Observation Missions (EOMs), the methodological framework for Election Exploratory Missions (EEMs) is simpler to implement and less time-consuming, while still providing the essential social media data needed to achieve the mission’s objectives. It is specifically designed for smaller teams.
| EU Election Observation Missions (EOMs) | EU Election Expert Missions (EEMs) |
| Number of social media platforms: 3 to 4 (Example: Facebook + Instagram + Twitter/X + TikTok) |
Number of social media platforms: not more than 2 suggested (Examples: Facebook + Twitter/X or Facebook + Instagram) |
AREAS of Assessment
|
AREAS of Assessment:
|
| Methodology Monitoring lists of electoral contestants Keyword analysis of electoral and/or divisive social media content |
Methodology Monitoring lists of electoral contestants NO keyword analysis of electoral and/or divisive social media content |
| Tools Sentione + Advanced tools (Programming, APIs and OSINT techniques - Programming and API access) Quantitative content analysis + Qualitative analysis of specific posts or narratives |
Tools Public stats + SentiOne Quantitative analysis + desk research |
Expected outputs
|
Expected Outputs
|
|
IT Support Local Staff = Up to 6/7 |
IT Support Local Staff = When SMA/MA is present up to 2 |
EOM Methodogical Framework
Phase 1 – Mapping the online environment
For EOMs, Phase 1 follows the common steps described in the “Phase 1 – Mapping the online environment” section of this Toolkit. The Social Media Analyst uses the desk review tools and, where available, ExM findings to:
- identify the most relevant platforms for the election;
- map key electoral contestants, institutional actors, influencers and online news outlets;
- define baseline levels of online impact (typical ranges of reach, engagement and virality) for these actors on each platform; and
- identify sensitive or high-risk topics that may generate polarisation, Derogatory Speech and/or Hateful Content, or information manipulation.
Based on this mapping, the EOM then decides which 3–4 platforms to monitor, constructs monitoring lists of contestants and other relevant actors, and designs keyword queries for electoral content and divisive issues. These decisions, together with the initial impact benchmarks and sensitive topics, form the starting point for Phase 2 (implementation of lists and queries and tracking of political ads).
Phase 2 – Implementing monitoring & collecting data
For EOMs, Phase 2 follows the common steps described in the “Phase 2 – Implementing monitoring & collecting data” section. On the basis of the Phase-1 mapping, the Social Media Analyst typically:
- implements monitoring lists on a social media listening tool (for example, SentiOne) for the official accounts of candidates, parties, the EMB and other relevant actors on the 3–4 selected platforms;
- designs and implements keyword queries to capture electoral procedures, divisive or polarising issues, information manipulation narratives and Derogatory Speech and/or Hateful Content; and
- tracks online political advertising by using Meta and Google ad transparency tools (and any available national tools) to collect data on ads placed by official contestants and key third-party actors.
The detailed instructions for configuring lists and queries and for collecting and exporting political advertising data are provided in the Phase 2 subchapters (“Social media listening tools: lists and queries” and “Online political advertising tools”).
Phase 3 - Analyse and assess the data
EOMs follow the common workflow described in the ‘Phase 3 – General analysis & cross-cutting variables’ subchapter under Online campaign: Analysis and Research. The EOM SMA applies this workflow to all four areas of assessment, using the specific chapters on Online campaigning, Political paid content, Information manipulation and Derogatory Speech and/or Hateful Content for detailed analysis techniques.
EEM Methodological Framework
Phase 1 – Mapping the online environment
For EEMs, Phase 1 also follows the common steps in the “Phase 1 – Mapping the online environment” section, but in a simplified form tailored to short-term missions. The expert uses the same desk-review tools and stakeholder consultations to:
- identify the main platforms and online spaces where electoral debate takes place;
- map the official social media accounts of key electoral contestants and the EMB, and, where possible, a small number of influential political actors;
- estimate basic online impact benchmarks for these actors (typical ranges of followers and interactions per post); and
- flag a small set of sensitive topics that may be relevant for information manipulation or Derogatory Speech and/or Hateful Content.
On this basis, EEMs typically monitor no more than two platforms, implement only monitoring lists (no keyword queries) and prepare a simplified set of online impact bands to support a largely qualitative assessment of the online campaign, information manipulation and derogatory speech.
Phase 2 - Implementing monitoring and collecting data
For EEMs, Phase 2 uses the same approach described in the “Phase 2 – Implementing monitoring & collecting data” section, but in a simplified form. EEMs normally:
- implement monitoring lists on one or two key platforms for the official social media accounts of contestants and the EMB, and, where possible, a small number of influential political actors;
- rely on the built-in filters and widgets of the social media listening tool (rather than custom keyword queries) to identify relevant posts and basic patterns; and
- use the Meta Ad Library (and other transparency tools where available) to collect illustrative information on online political advertising by official contestants and, when feasible, by relevant third-party actors.
EEMs usually do not implement keyword queries and do not perform full-scale political advertising analysis. The goal of Phase 2 for an EEM is to obtain a focused, qualitative picture of the online campaign, information manipulation and derogatory speech, rather than comprehensive datasets.
Phase 3 - Analyse and assess data
EEMs use the same general workflow as described in ‘Phase 3 – General analysis & cross-cutting variables’ under Online campaign: Analysis and Research, but typically work with smaller datasets and rely more on descriptive statistics combined with qualitative examples. The area-specific chapters should be used selectively, focusing on the issues most relevant to the EEM’s mandate.
Glossary
This glossary provides clear definitions of the key terms, acronyms, and concepts used in social media analysis for election observation. It is designed to help readers, especially those new to the field, quickly understand the technical language and methodologies referenced throughout the Toolkit. Entries cover essential terminology related to digital platforms, online campaigning, disinformation, data collection, and analytical tools, as well as broader concepts such as algorithmic transparency, digital ecosystems, and open-source intelligence (OSINT). By offering a shared vocabulary, the glossary ensures consistency, clarity, and accessibility for all users of the Toolkit.
Term |
Definition |
Ad Library |
A public database created by social media platforms to provide transparency about paid content. Libraries typically include the advertiser's identity, targeting information, spend, and impressions. Used for monitoring political and issue-based ads. |
Ads.txt file |
A public file hosted by a website that lists which companies are authorized to sell its advertising space. Investigators use ads.txt to identify affiliate relationships and trace ad networks. |
Advanced data collection |
The use of programming languages to access Application Programming Interfaces (APIs) provided by social media companies to search by keyword or account and receive back .csv files of social media data. |
Algorithm |
A fixed series of steps that a computer performs in order to solve a problem or complete a task. Social media platforms use algorithms to filter and prioritise content for each individual user based on various indicators, such as their viewing behaviour and content preferences. |
API - Application programming interface |
Programming interfaces allowing programmers and developers to develop applications that can connect directly to the platforms to extract data or execute instructions. Usually, this programming requires knowledge of languages such as R, Python, or Javascript. |
AI - Artificial intelligence |
Computer programs that are "trained" to solve problems that would normally be difficult for a computer to solve. These programs "learn" from data parsed through them, adapting methods and responses in a way that will maximize accuracy. |
Astroturfing |
Organised activity on the Internet that is intended to create a false impression of a widespread, spontaneously arising, grassroots movement in support of or in opposition to something (such as a political policy) but that is in reality initiated and controlled by a concealed group or organisation. |
Automated dashboard |
A dashboard, usually web-based, that allows authorised users to visualise, monitor and extract data from social media platforms according to standard procedures and in standard formats. CrowdTangle or SentiOne are examples of automated dashboards. |
Automation |
The process of designing a 'machine' to complete a task with little or no human direction. It takes tasks that would be time-consuming for humans to complete and turns them into tasks that are completed quickly and almost effortlessly. For example, it is possible to automate the process of sending a tweet, so a human doesn't have to actively click 'publish'. |
Big data |
Large sets of unstructured or structured data that can be powerful if leveraged properly. Much of the data social marketers encounter has already been parsed into a digestible format (such as customer-data spreadsheets or your social analytics dashboard). So-called big data is complex and requires sorting, analysing, and processing—but with the right analysis, the potential for insight is endless. |
Black hat SEO (search engine optimization) |
Aggressive and illicit strategies used to artificially increase a website's position within a search engine's results, for example changing the content of a website after it has been ranked. These practices generally violate the given search engine's terms of service as they drive traffic to a website at the expense of the user's experience. |
Botnet |
A collection or network of bots that act in coordination and are typically operated by one person or group. |
Bots |
Social media accounts that are operated entirely by computer programs and are designed to generate posts and/or engage with content on a particular platform. Researchers and technologists take different approaches to identifying bots, using algorithms or simpler rules based on the number of posts per day. |
Breakout Scale |
A six-level narrative tracking scale used to evaluate the amplification and real-world impact of an influence operation. |
Clickbait |
Marketing, advertising or information material that employs a sensationalised headline to attract clicks. They rely heavily on the "curiosity gap" by creating just enough interest to provoke engagement. |
Clickthrough rate |
Common social media metric used to represent the number of times a visitor clickthrough divided by the total number of impressions a piece of content receives. |
Computational propaganda |
Use of algorithms, automation, and human curation to purposefully distribute political information over social media networks. |
Conversion rate |
It refers to a common metric tracked in social media that is the percentage of people who completed an intended action (i.e. filling out a form, following a social account, etc.). |
CIB - Coordinated Inauthentic Behaviour |
Groups of pages or people working together to mislead others about who they are or what they are doing in the online environment. |
Crowdsourcing |
Similar to outsourcing, it refers to the act of soliciting ideas or content from a group of people or users, typically in an online setting. |
Dark ads |
Advertisements that are only visible to the publisher and their target audience. For example, Facebook allows advertisers to create posts that reach specific users based on their demographic profile, page 'likes', and their listed interests, but that are not publicly visible. These types of targeted posts cost money and are therefore considered a form of advertising. Because these posts are only seen by a segment of the audience, they are difficult to monitor or track. |
Dashboard |
An information management tool that visually tracks, analyses and displays key indicators, metrics and key data points to monitor a specific process. In relation to social platforms monitoring, it is a single screen where analysts can view their feeds, see and interact with ongoing conversations, keep track of social trends, access analytics, and more. |
Data analysis |
The application of tools and techniques to use information to provide answers to pre-defined questions, that is, to create knowledge; data visualisation often assists in this process. |
Data archiving |
Process of saving social media data. |
Data collection |
Gathering information relevant to answering a defined set of questions and doing so in a way which ensures the information is structured for analysis, and compliant with data protection regulations and ethical standards. |
Data mining |
The process of monitoring large volumes of data by combining tools from statistics and artificial intelligence to recognize useful patterns. |
Data visualisation |
The process of using tools and techniques to communicate simply and rapidly the answers from data analysis to lay audiences; can also assist in data analysis. |
Debunking |
In the context of fact-checking it refers to the process of showing that an item (text, image or video) is less relevant, less accurate, or less true than it has been made to appear. |
Deep fakes |
Fabricated media produced using artificial intelligence. By synthesising different elements of existing video or audio files, AI enables relatively easy methods for creating 'new' content, in which individuals appear to speak words and perform actions, which are not based on reality. |
Derogatory speech or language |
Any kind of communication that makes depreciative comments or judgements about a person or a group, based on their identity factors, such as religion, ethnicity, nationality, race, colour, descent, gender, etc . |
Disinformation |
False information that is deliberately created or disseminated with the express purpose to cause harm or deceive. |
Dormant account |
A social media account that has not posted or engaged with other accounts for an extended period of time. In the context of information operations/campaigns, this description is used for accounts that may be human- or bot-operated, which remain inactive until they are 'programmed' or instructed to perform another task. |
Doxing or doxxing |
The act of publishing private or identifying information about an individual online, without his or her permission. This information can include full names, addresses, phone numbers, photos and more. Doxing is an example of malinformation, which is accurate information shared publicly to cause harm. |
Echo-chamber |
A situation where certain ideas, beliefs or data points are reinforced through repetition of a closed system that does not allow for the free movement of alternative or competing ideas or concepts. |
Encryption |
The process of encoding data so that it can be decoding only by intended recipients. Many popular messaging services such as WhatsApp encrypt the texts, photos and videos sent between users. This prevents governments from reading the content of intercepted WhatsApp messages. |
Engagement rate |
A popular social media metric used to describe the amount of interaction -- likes, shares, comments -- a piece of content receives. |
Fact-checking (in the context of information disorder) |
The process of verifying the factual accuracy or truthfulness of a statement, claim, or piece of information, usually online information such as politicians' statements and news reports. |
Fake followers |
Anonymous or imposter social media accounts created to portray false impressions of popularity about another account. Social media users can pay for fake followers as well as fake likes, views and shares to give the appearance of a larger audience. |
Filter bubble |
The isolation that can occur when websites and social media platforms make use of algorithms to selectively assume the information a user would want to see, and then give information to the user according to this assumption. Websites make these assumptions based on the information related to the user, such as former click behaviour, browsing history, search history and location. For that reason, the websites are more likely to present only information that will abide by the user's past activity. |
FIMI - Foreign Information Manipulation and Interference |
A pattern of behaviour that threatens or has the potential to negatively impact values, procedures and political processes. Such activity is manipulative in character, conducted in an intentional and coordinated manner. Actors of such activity can be state or non-state actors, including their proxies inside and outside of their own territory |
Geotag |
The directional coordinates that can be attached to a piece of content online. For example, Instagram users often use geotagging to highlight the location in which their photo was taken. |
Geotargeting |
A feature on many social media platforms that allows users to share their content with geographically defined audiences. Instead of sending a generic message for the whole world to see, the messaging and language of a content are refined to better connect with people in specific cities, countries, and regions. |
Handle |
The term used to describe someone's @username on X/Twitter. For example, Mr. Eddie Vedder X/Twitter handle is @eddievedder. |
Hashtag |
A tag used on a variety of social networks as a way to annotate a message. A hashtag is a word or phrase preceded by a "#"" (i.e. #Brexit). Social networks use hashtags to categorise information and make it easily searchable for users. |
Hate speech |
Any kind of communication that attacks or uses discriminatory language with reference to a person or a group on the basis of their religion, ethnicity, nationality, race, colour, descent, gender or other identity factor. |
Hateful content |
Any kind of content that incites hate towards a person or a group based on their religion, ethnicity, nationality, race, colour, descent, gender or other identity factor. |
Incitement |
Any form of communication that urges or requests others to engage in dangerous or violent behaviour or speech. Incitement speech does not engage in violence itself but incentivizes others to do so. |
Inflammatory speech or language |
Any form of communication that may excite anger, disorder or tumult. May also be referred to as "dangerous speech." |
Influencer |
A social media user with a significant audience who can drive awareness about a trend, topic, company, or product. |
Information disorder |
A conceptual framework for examining misleading types of content, such as propaganda, lies, conspiracies, rumours, hoaxes, hyper partisan content, falsehoods or manipulated media. It comprises three different types: mis-, dis- and mal-information. |
Information manipulation |
The strategies employed by a source or producer of information to deceive the receiver or consumer into interpreting that information in an intentionally false way. Information Manipulation may consist of different and integrated tactics, techniques and procedures (TTPs, e.g. coordinated or lone inauthentic actors, click farms, trolls, bots and botnets, cyborgs, other forms of manufactured amplification, disinformation etc.) used to channel public opinion towards a political goal of an informational agent using deceptive or misleading contents |
Infrastructure-level blocking |
A suppression method where access to websites, platforms, or online content is limited or blocked by governments or ISPs through DNS tampering, IP blocking, or service throttling. Often used to restrict political or electoral information. |
IM - Instant Messaging |
A form of real-time, direct text-based communication between two or more people. More advanced instant messaging software clients also allow enhanced modes of communication, such as live voice or video calling. |
List |
A group of pages, groups or accounts ensembled in any homogeneous way, according to a given criteria, to be monitored in automated dashboards like CrowdTangle or SentiOne. Monitored lists provide data about the content published by the pages, groups or accounts included on the list during a given period of time. |
Machine learning |
A type of artificial intelligence in which computers use huge amounts of data to learn how to do tasks rather than being programmed to do them. It can also refer to an approach to data analysis that involves building and adapting models, which allow programs to "learn" through experience. |
Malinformation |
Genuine information that is shared to cause harm. This includes private or revealing information that is spread to harm a person or reputation. |
Manual data collection |
A manual search for specific keywords or actors on a regular basis and saving related post data such as image files, post text, date, etc. |
Manufactured amplification |
Occurs when the reach or spread of information is boosted through artificial means. This includes human and automated manipulation of search engine results and trending lists, and the promotion of certain links or hashtags on social media. |
Mass Reporting |
The coordinated use of platform reporting features by multiple users to remove or penalise a target post or account. Often used as a suppression tactic against journalists, political figures, or activists. |
Meme |
Captioned photos or short videos that spread online, and the most effective are humorous or critical of society. |
Micro-targeting |
A marketing strategy that uses people's data — about what they like, who they're connected to, what their demographics are, what they've purchased, and more — to segment them into small groups for content targeting. |
Misinformation |
Information that is false, but not intended to cause harm or deceive. For example, individuals who don't know a piece of information is false may spread it on social media in an attempt to be helpful. |
Narrative hijacking |
The strategic use of popular hashtags, keywords, or phrases to flood or redirect attention away from their original meaning. Often used to dilute opposition messaging or manipulate trending topics. |
Net neutrality |
The idea, principle, or requirement that Internet service providers should or must treat all Internet data as the same regardless of its kind, source, or destination. |
Organic content |
Not sponsored content from human accounts, content produced on social media without paid promotion. |
Organic reach |
The number of unique users who view content without paid promotion. |
OSINT tools and techniques |
Open-source intelligence (OSINT) is the practice of collecting information from published or otherwise publicly available sources. OSINT tools and techniques refers to the tools and techniques used by OSINT practitioners for finding and retrieving information. |
Paid reach |
The number of users who have viewed your published paid content, from ads to sponsored and promoted content. Paid reach generally extends to a much larger network than organic reach—messages can potentially be read by people outside of a concrete contact list. |
Pivoting |
The process of using a known selector (e.g. username, domain) to find related entities or assets during an OSINT investigation. Pivoting helps identify networks or campaigns based on shared infrastructure or behavioural patterns. |
Political advertising |
Any type of advertising for a political issue for which all or part of the reach is paid for. Depending on the laws of each country and the terms of each distribution platform, political advertising may or may not be marked as such. It is frequently used during electoral periods. |
Propaganda |
True or false information spread to persuade an audience, but often has a political connotation and is often connected to information produced by governments. It is worth noting that the lines between advertising, publicity and propaganda are often unclear. |
Reach |
A data metric that refers to the total number of unique users who have seen a given content. It provides a measure of the size of the audience and is a fundamental metric for understanding the overall scope and influence of an online presence. |
Saved search |
A saved query (an articulated ensemble of keywords) that is used in automated dashboards like SentiOne or Brandwatch to monitor posts published in social media platforms about the issue that the query relates to. May reflect the social media coverage about a given issue in a given period of time. |
Scraping |
The process of extracting data from a website or a social media platform. |
Selector |
A traceable data point used in digital investigations to identify or link content or actors. Selectors include usernames, emails, domains, phone numbers, hashtags, profile pictures, or other metadata that can be cross-referenced or "pivoted" to expand the investigation. |
SEO - Search Engine Optimisation |
The process of increasing the quality and quantity of online traffic by increasing the visibility of a website or a page to users of a web search engine. |
Search engine |
A software system that is designed to carry out web search (internet search) in response to a question, a keyword or a query inserted by a user. |
Sentiment analysis |
An attempt to understand how an audience feels about some content or account. At scale, sentiment analysis typically involves natural language processing or another computational method to identify the attitude contained in a social media message. Different analytics platforms classify sentiment in a variety of ways; for example, some use "polar" classification (positive or negative sentiment), while others sort messages by emotion or tone (Contentment/Gratitude, Fear/Uneasiness, etc.). |
Shadow campaigns |
A communication campaign that is paid for with money whose origin is not disclosed or is hidden. May also refer to communication campaigns that are not paid but whose sources or authors remain undisclosed or hidden. |
Shadowbanning |
A platform practice in which a user's content is partially or fully hidden from others without their knowledge. Shadowbanned posts may not appear in search results, hashtags, or timelines, reducing visibility without formal removal. |
Share of voice |
A measure of how many social media mentions a particular item is receiving in relation to its competition. Usually measured as a percentage of total mentions within a sector or among a defined group of competitors. |
Social Listening Tool |
A tool (usually online) that provides access to several social media platforms in one single dashboard and offers the user ways of searching and filtering information in those social media platforms, in accordance with the available APIs. Using user-friendly social listening tools (e.g. SentiOne) to search for and download data as a .csv or .xls file. |
Social media amplification |
When a content is shared, either through organic or paid engagement, within social channels thereby increasing word-of-mouth exposure. Amplification works by getting a content promoted (amplified) through proxies. Each individual sharer extends the messaging to their personal network, who can then promote it to their network and so on. |
Social media monitoring |
The systematic search for, collection, and analysis of specific instances of content, actors and connections on social media platforms, such as Facebook, Twitter, YouTube, Instagram, TikTok, etc. |
Sock puppet |
An online account that uses a false identity designed specifically to deceive. Sock puppets are used on social platforms to inflate another account's follower numbers and to spread or amplify contents to a mass audience. The term is considered by some to be synonymous with the term "bot". |
Spam |
Unsolicited, impersonal online communication, generally used to promote, advertise or scam the audience. |
Suppression |
Coordinated actions aimed at reducing the visibility, accessibility, or perceived legitimacy of targeted actors or messages. Tactics include mass reporting, shadowbanning, cyberattacks, infrastructure blocking, or intimidation. |
Third-Party Accounts/Pages |
Accounts or pages that advocate for/against a given candidate, party or political platform but are not formally affiliated with that candidate, party or political platform. It may be groups, pages or accounts created by regular users of a platform to support/discredit a candidate or party. |
Trending topic |
The most talked about topics and hashtags on a social media network. These commonly appear on networks like X/Twitter and Facebook and serve as clickable links in which users can either click through to join the conversation or simply browse the related content. |
Troll farm |
A group of individuals engaging in trolling or bot-like promotion of narratives in a coordinated fashion. |
Trolling |
The act of deliberately posting offensive or inflammatory content to an online community with the intent of provoking readers or disrupting conversation. Today, the term "troll" is most often used to refer to any person harassing or insulting others online. However, it has also been used to describe human-controlled accounts performing bot-like activities. |
User-Generated Content (UGC) |
Blogs, videos, photos, quotes and other forms of content that are created by individuals and users of online platforms, including social media platforms.. |
Verification |
The process of determining the authenticity of information posted by unofficial sources online, particularly visual media |
Vicarious Trauma |
Psychological distress experienced by observers or investigators exposed to repeated or disturbing content, such as hate speech, graphic violence, or targeted abuse, often in digital spaces. Common in social media monitoring roles. |
Viral reach |
Users who saw one's content thanks to a third person, as opposed to directly through your Page, i.e. when a friend shares one of your posts, for example. |
VPN - Virtual Private Network |
Tool used to encrypt a user's data and conceal his or her identity and location. |
Research and Analysis
This section provides methodological guidance for the assessment of online campaigns, focusing on the integrity and transparency of information circulating in the digital space. It covers key aspects such as content manipulation, harmful speech, privacy, and safety considerations in the context of social media monitoring. The aim is to support a structured and responsible analysis of the online environment, identifying trends and risks that may influence the electoral process and public debate.

After the project set up in Phases 1 and 2, the mission has identified the main platforms and actors and has collected data from social media listening tools, ad transparency tools and other sources. Phase 3 explains how to move from these raw datasets to structured findings that can feed the mission’s assessment and recommendations.
The steps below apply to all four areas of assessment (online campaigning, political paid content, information manipulation, and Derogatory Speech and/or Hateful Content). The area-specific chapters that follow provide more detailed guidance and examples for each area.
This chapter explains how to assess online impact (reach, engagement and virality) and the potential to harm across the four areas of assessment. It is designed to be simple and practical, so that Social Media Analysts (SMAs) can:
- quickly flag which posts or ads deserve closer attention, and
- later support a broader impact assessment at narrative level, including offline consequences.
All the measures below must be interpreted in light of the benchmarks defined in Phase 1 (typical audiences and interaction levels in the country and on each platform).
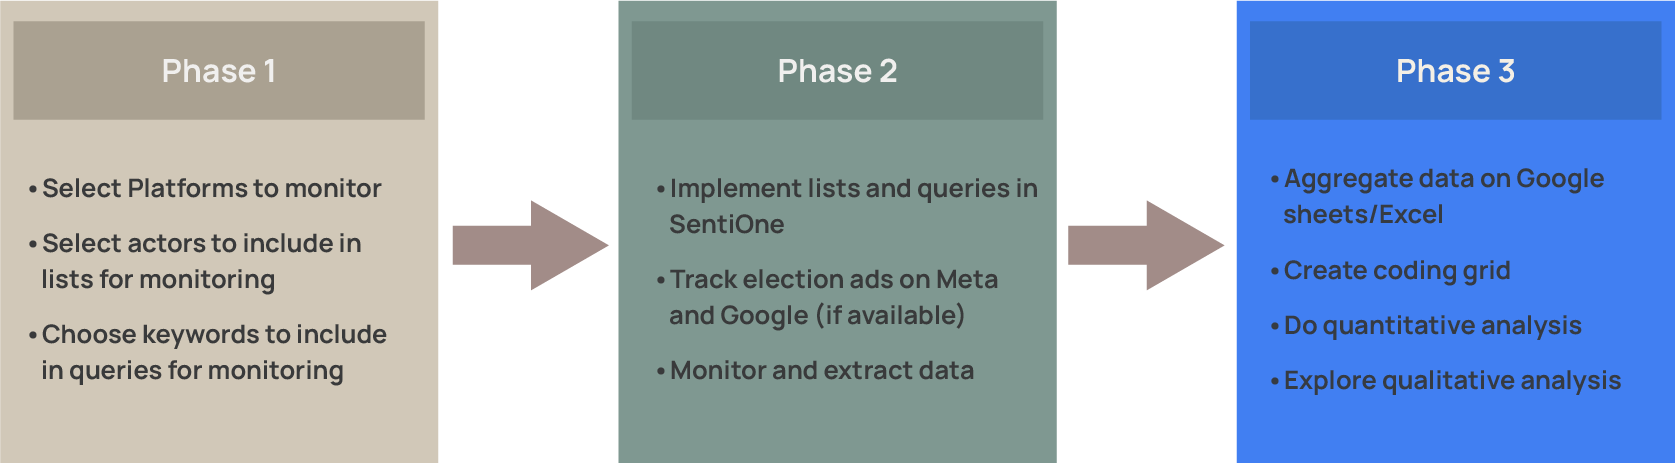
General workflow
The third stage of the implementation of the methodological framework for EOMs is the analysis of the data that is collected. This is the data on which the social media analyst must support his/her analysis on the established areas of assessment for the mission: Online Campaign: Political Advertising; Information Manipulation; and Derogatory Speech and Hateful Content. With the correct implementation of the methodological framework, the data collected should be able to support the assessment of the electoral process in all those areas.
On the data collected, both from the social media activity (via SentiOne) or from the ad activity (via ad dashboards), there are two types of analysis that can be made, one based on the lists and other based on the queries.
The monitoring based on lists will mostly (although not exclusively) help us analyse the campaign run by candidates and supporters online.
- Data collection
- Coding of data
- Quantitative analysis (statistics)
You may also identify instances of derogatory speech, hateful content or information manipulation (qualitative analysis), when those are enacted by the political actors included in the lists.
The monitoring based on keywords will help us identify viral content. It will help us identify instances of derogatory speech, incitement to violence, information manipulation, disinformation, etc.
- Data collection
- Coding of data
- Qualitative analysis
Use the Excel or Google Sheets output from SentiOne or the ad dashboards and create a coding grid to characterize the content. Insert the relevant categories as columns following the data that comes directly from SentiOne. In that way your team will be directly addressing each post selected for categorization. Depending on the size and experience of your team and the quantity and diversity of lists and queries that you implemented, consider coding between 10 and 30 posts per week. When the number of posts per week is greater than that (which is usually the case), you should use a sampling criteria and, in that case, we recommend selecting for coding the posts with most views or interactions, as those have been the most relevant in capturing the attention of the audiences.
What kind of categories do you need to create?
This will be highly dependent on the type of election, the political situation in the country and the data and sources of data that you are available. The following list is just an example of some categories that you may use:
- Translation (if that is the case)
- Type of page/account
- Political affiliation
- Type of post (campaign post, report on irregularities, discreditation of the process, disinformation…)
- If this is a campaign post, what is the topic?
- Is it manipulative?
- Does it contain derogatory speech, hateful content?
- Does it contain information manipulation?
It may be useful to set up your categories and sub-categories in one Excel or Google sheet (as in the examples below) and describe each category in detail but succinctly.
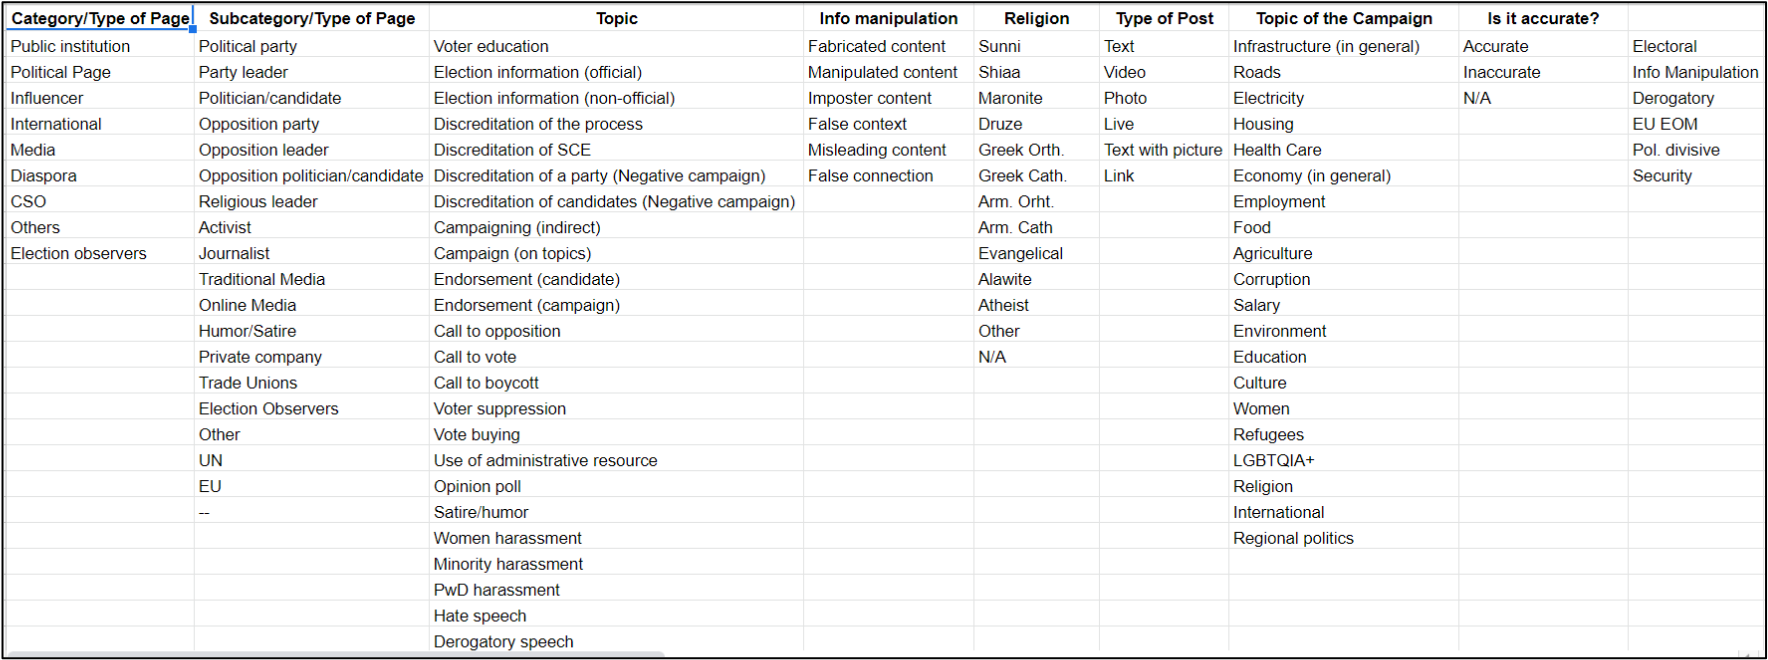
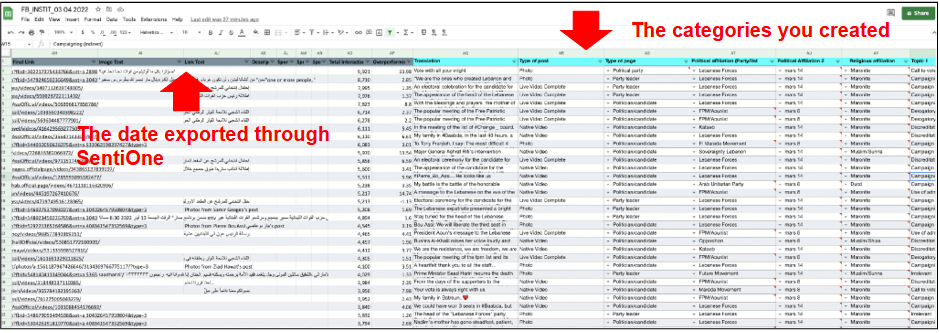
The attribution of these categories and sub-categories to each social media publication will correspond to a qualitative analysis of data that is collected and sampled using quantitative criteria (the quantitative data feeding the qualitative analysis). When using this method, you will be doing a qualitative analysis, but supported on quantitative data and guided by consistent, objective and transparent criteria and will be able to support your qualitative assessments of the election on quantitative data.
Online impact
In this toolkit, online impact is an initial snapshot of how far and how strongly a piece of content stands out on a given platform.
It combines three elements:
- Reach – how many people are likely to have seen it.
- Engagement – how many people interacted with it.
- Virality – how fast it is growing compared with what is normal for that account.
These indicators are relative:
- to the country and platform (for example, 1 million views in a small country is different from 1 million in a very large one);
- to the actor (for example, a local contestant vs a national one).
- To the intended audience (for example, something targeting mine workers vs all voters)
Phase 1 and Phase 2 provide baselines. Phase 3 uses those baselines to classify content into low / medium / high impact and to identify items that may require closer analysis.
Reach level (relative to intended audience)
Where data are available (views, impressions, reach), SMAs can classify reach in relation to the intended audience of the content:
- the general electorate;
- a specific group (for example, military staff, diaspora, language community);
- members of a closed group or channel.
As a simple rule of thumb:
| Estimated share of intended audience reached | Reach level |
| < 1% | LOW |
| 1–10% | MEDIUM |
| > 10% | HIGH |
Examples:
- A post aimed at all voters with an estimated reach of 0.5% of the electorate → low reach.
- A video towards teachers, appealing to them to strike against the government, reached 3000 people (there are 10000 teachers in the country) → high reach within that niche (30%).
These percentages are indicative only. Each mission should adapt them based on Phase-1 benchmarks and data availability.
Interaction rate
Interaction rate helps to see whether a post or ad is receiving more engagement than is normal for that account.
A simple formula is:
Interaction rate (%) = total interactions ÷ number of followers × 100
Where:
- total interactions = reactions + comments + shares (or equivalent);
- followers = follower count of the account that posted it.
Interpretation:
- Up to ~10–20% – common for active accounts;
- Above ~20–50% – strong engagement;
- Above ~100% – indicates that the content is attracting interactions beyond the account’s follower base (for example, via shares, recommendations or external embedding). This is not necessarily problematic, but it usually signals unusually high impact.
The exact thresholds should be adjusted using Phase-1 “normal” values for the relevant actor type and platform. For example. TikTok has regular lower interaction rates (more views than comments, likes and shares) than Facebook.
Virality (growth over time)
Virality looks at how fast a post is growing, not just its final numbers. The aim is not to predict what will go viral, but to identify content that is already growing unusually fast and may need attention.
This method is deliberately simple and can be applied with basic exports or manual checks.
How to calculate virality (simplified)
- Pick a visible post
- Only calculate virality for content that already has a significant number of interactions compared to the account’s usual posts.
- Use Phase-1 benchmarks or initial descriptive statistics to identify such posts.
- Record the current metrics (time T₀)
- Total interactions = likes + comments + shares (or equivalent).
- Shares (alone), if available.
- Follower count of the account that posted it.
- Check the same post again after 1 hour (time T₁)
- Record the new total interactions and shares.
- Calculate growth relative to follower base
- A simple virality score can be: Virality score (%) = (Interactions(T₁) – Interactions(T₀)) ÷ followers × 100
- Classify virality level
Use the growth relative to follower base in that hour:
| Growth in interactions (per hour) vs followers | Virality level |
| ≥ +100% (e.g. interactions doubled vs followers) | HIGH |
| +25% to +99% | MEDIUM |
| < +25% | LOW |
These thresholds are indicative. Missions can adapt them (for example, using longer intervals in low-activity contexts). The key idea is to identify posts where interactions are increasing much faster than normal for that account, which suggests strong amplification.
Initial online impact assessment (post-level)
Combining the elements above, SMAs can make a quick, post-level online impact assessment, for example:
- LOW impact – low reach, normal interaction rate, low virality.
- MEDIUM impact – medium reach and/or strong interaction rate, medium virality.
- HIGH impact – high reach and/or very strong interaction rate and/or high virality (especially if clearly above the account’s usual posts).
This initial online impact classification is a screening tool. It helps decide which content to look at first in Phase 3 and in the area-specific chapters. It does not yet take into account whether the content is harmful which is essential to define priorities.
A full impact assessment (including harm) is done later, at narrative level, looking at:
- total reach over time and across platforms;
- who is exposed and how often;
- whether the narrative spills into offline debate, media coverage or real-world incidents.
That broader assessment is covered in the final part of this chapter.
Potential to harm
The potential to harm can be assessed more thoroughly after a full investigation, but an initial classification is useful already at Phase 3. At this stage, it is based on:
- what is visible in the content;
- how it might affect the election or public safety;
- whether it targets vulnerable groups or rights.
How to assess potential harm (initial classification)
Choose one of three levels based on what the post or ad could realistically lead to, if repeated or amplified:
| Harm level | What it might cause |
| HIGH | Immediate or serious risk to human safety or severe disruption of the electoral process. Examples: explicit incitement to violence; specific threats against individuals; clear calls to block voting, destroy materials or disrupt counting; instructions or narratives that could directly lead to voter suppression or serious unrest. |
| MEDIUM | Can mislead voters or fuel divisions, but is not immediately disruptive on its own. Examples: false or misleading claims about contestants, institutions or voting procedures that may reduce trust or participation; content that strongly reinforces polarisation or hostility but stops short of direct calls for harm. |
| LOW | Unlikely to cause harm beyond ordinary political disagreement. Examples: harsh opinions, partisan commentary or criticism that do not involve factual distortion about the process or incitement against individuals or groups. |
This is an initial harm assessment at content level. It should be revisited as more information becomes available, including:
- whether the content is part of a broader narrative;
- how widely it spreads;
- any offline incidents linked to it.
Some examples:
- High potential to harm
- Explicit incitement to violence or harassment.
- Specific threats against candidates, voters, election officials or groups.
- False information on voting procedures, dates, or eligibility that can mislead voters in practice.
- Content likely to suppress turnout or restrict voter freedom of choice.
- Repeated claims that the election is illegitimate or “rigged” without evidence, especially when amplified by influential actors.
- Medium potential to harm
- Distorted information about political actors, institutions or processes that may increase distrust but does not directly instruct people to break the law or abstain.
- False or misleading narratives that erode confidence in institutions or in the media.
- Polarising narratives that exploit existing social tensions and vulnerabilities.
- Low potential to harm
- Criticism, satire or partisan commentary that does not rely on falsehoods about the electoral process and does not include incitement to violence or harassment.
- Content that is unlikely to affect participation, trust or public safety beyond ordinary political disagreement.
Analysts should always consider context, audience and intent when judging potential harm. Is this narrative likely to be reinforced by existing social vulnerabilities? Is it being pushed by a particularly motivated actor?
Combining impact and harm: a simple prioritisation grid
Not every post with high online impact is critical for the mission, and not every harmful post reaches many people. To prioritise what to investigate and report on, SMAs should combine the online impact and potential harm assessments.
A simple decision grid:
| Low impact | Medium impact | High impact | |
High harm |
Priority (must be reviewed) – even if impact is still low, because the content is severe and could escalate. | High priority – urgent review and likely inclusion in findings; consider early warning. | Critical priority – full investigation, narrative-level tracking, and close coordination with the Core Team. |
Medium harm |
Normally low priority, unless it is part of a larger pattern. | Moderate priority – consider sampling for examples and monitoring over time. | High priority – analyse and report; assess whether repeated exposure could shift perceptions or behaviour. |
Low harm |
Usually no follow-up needed. | Low to moderate priority – may be useful as context, but not urgent. | Context-only – note as an example of high visibility but low harm (for example, humorous or trivial content); no need for deep investigation. |
Key principles:
- Anything with HIGH potential to harm must be looked into, regardless of current reach or virality. A single explicit call to violence or serious disruption is relevant even with modest numbers.
- Not all high-impact content needs deep analysis. A viral meme with low harm potential may be recorded as context but does not require the same attention as a high-harm narrative with moderate visibility.
- The grid should be used to prioritise time and resources, not as a rigid scoring system.
Online campaigning
Observer question
“How are electoral contestants using social media to campaign, and who is getting most of the online attention?”
This chapter helps observers analyse the organic (non-paid) online campaign: how parties, candidates and other contestants use social media to communicate with voters, what topics they promote, and how much attention they receive compared to others. It builds on the Phase 3 workflow and the benchmarks defined in Phase 1 and Phase 2.
Scope and link to other areas
In this area of assessment, the focus is on organic content published by electoral contestants and other relevant actors (such as the EMB and key institutional accounts). The goal is to understand:
- who is most visible and active online;
- which platforms matter most for the campaign;
- which topics dominate the online agenda; and
- whether certain contestants are systematically advantaged or disadvantaged in the online space.
Online campaigning is the baseline area: most posts will simply be part of normal political debate. When content also involves information manipulation or Derogatory Speech and/or Hateful Content, it should be coded and analysed in those specific areas, using cross-references between chapters rather than duplicating analysis.
You may wish to cross-reference:
- Information manipulation (Content / Platform Manipulation; Suppression and Silencing);
- Derogatory Speech and/or Hateful Content;
- Political paid content when posts are clearly sponsored or linked to ad campaigns.
Data and sampling (what you work with)
This chapter assumes you already have:
- Monitoring lists of electoral contestants and other actors set up in a social listening tool (Phase 1 & 2).
- Exports of posts from those lists for the relevant period (for example, weekly CSV files).
- Basic metrics, at minimum:
- date/time, platform, account;
- content (text or link to content);
- interactions (reactions, comments, shares);
- views / impressions or an influence score (when available).
Sampling is mission-dependent, but common options include:
- Full coverage: all posts from a limited number of contestants/platforms.
- Top-N sampling: the X most impactful posts per contestant per week (using the online impact proxy metric defined in Phase 3).
Core research questions and indicators
You can structure the analysis around a small set of standard questions. Below is a suggested grid (adapted from the former “Step 3 – Data analysis” in the 4 Areas section):
Question 1 – Who used social media the most for online campaigning?
- Indicator: number of posts per contestant.
- Method: count all posts per contestant (overall and per platform).
- Use: describes which contestants are most active online and whether activity is balanced.
Question 2 – Which platforms were used the most?
- Indicator: number of posts per platform, per contestant.
- Method: count posts per contestant per platform (e.g. Facebook, X, Instagram, TikTok, YouTube).
- Use: identifies the main campaign platforms and where each contestant focuses their efforts.
Question 3 – Which contestants received the most user engagement?
- Indicator: total interactions per contestant (reactions, comments, shares; optionally views/impressions).
- Method: sum interactions per contestant and, where possible, normalise by number of followers or average engagement rate.
- Use: shows the distribution of online attention and whether some contestants dominate the online conversation.
Question 4 – How often did contestants use negative or positive campaigning?
- Indicator: number and share of posts coded as positive, negative or neutral.
- Method:
- define “negative” / “positive” categories with the Core Team;
- manually code a sample of posts;
- calculate the share of each category per contestant.
- Use: highlights differences in tone and style between contestants.
(Optional: if a mission uses automated sentiment analysis, this can provide a rough signal, but human coding should be used to confirm patterns, especially in non-English languages.)
Question 5 – Which topics did contestants focus on?
- Indicator: number and share of posts by topic (e.g. economy, security, corruption, identity issues, electoral procedures).
- Method:
- build a topic codebook (topics can be tailored to the country);
- label posts (or a representative sample) by main topic;
- calculate distributions per contestant and over time.
- Use: shows how different contestants frame the campaign and which issues they prioritise.
Question 6 – Did contestants share false or misleading claims, or derogatory or hateful content?
- Indicator: number of posts by official contestants that:
- contain false or misleading information (especially about electoral procedures or integrity); or
- contain hateful or derogatory content targeting individuals or groups.
- Method:
- flag such posts in the coding grid and cross-reference:
- Information manipulation chapter (for misleading or deceptive content);
- Derogatory Speech or Hateful Content chapter (for attacks on individuals or groups).
- flag such posts in the coding grid and cross-reference:
- Use: links the official online campaign to the more problematic areas of the information environment.
For reporting, focus on clear, comparable statistics (e.g. shares, ratios) and illustrative examples rather than raw counts alone.
Using online impact within the online campaign
Online campaigning analysis should be consistent with the online impact concept defined in Phase 3:
- Use your benchmarking bands (normal / high / viral) per platform and actor type (from Phase 1).
- When describing findings, combine volume and impact:
- “Contestant A posted less frequently than Contestant B, but a larger share of A’s posts reached high or viral impact bands, especially on TikTok.”
- Pay attention to:
- outlier posts: content with unusually high / low impact compared to that actor’s norm - this can be a sign of information manipulation;
- platform asymmetries: one contestant dominating engagement on a specific platform that is central in that country.
Online campaigning may reveal structural imbalances in visibility and influence, even when no clear manipulation or hateful content is present. These imbalances can still be relevant for the mission’s assessment of pluralism and equitable conditions.
When is “business as usual” vs when to escalate?
Most content will fall into “normal political debate”, even when it is polarised or strongly worded. As a rule of thumb:
- If a post is within normal impact bands and does not raise red flags, it can be treated as regular campaign content.
- If a post or narrative:
- reaches high or viral impact, and/or
- could involve deceptive techniques, coordinated behaviour, or derogatory / hateful content,
then it should be flagged and analysed in the relevant chapter: - Content Manipulation / Platform Manipulation / Suppression (for information manipulation and inauthentic behaviour);
- Derogatory Speech & Hateful content (for identity-based abuse, incitement, or intimidation).
Use the coding grid to tag posts with both the area of assessment and the risk level (low/medium/high potential harm), so that the mission can prioritise investigation and reporting on the most consequential issues.
EOM vs EEM use of this chapter
Both EOMs and EEMs can use the same analytical logic, with differences mainly in depth:
- EOMs
- usually cover more platforms and more contestants;
- can run full quantitative analysis (all or most posts) plus topic and tone coding;
- are expected to link online campaigning patterns systematically to findings and recommendations.
- EEMs
- generally monitor fewer platforms and rely more on descriptive statistics and selected examples;
- may focus on a few key indicators (e.g. who dominates the online space, main topics, notable negative campaigning or misleading claims);
- should still use the same categories, but with lighter data requirements.
Political paid content
This chapter assumes that basic data collection from political ad libraries has already been set up as described in Phase 2 – Implementing monitoring & collecting data. For assessing the online impact and potential harm of ads and related narratives, see Phase 3 – General analysis & cross-cutting variables and the Impact and harm assessment across areas chapter.
Observer Question
“Is this content part of a larger campaign of paid digital influence? Who’s behind it—and what are they trying to achieve?”
This chapter helps observers investigate paid political advertising, assess the intent and reach of influence campaigns, and link online ads to wider narratives or actors.
1. What to Look For in Political Ads
So it is important to point out that all the red flags identified in the previous guides of this toolkit are considerably more important if combined with promoted content. Besides those, below listed some other particular red flags to have a look out:
| Red Flag | Why It Matters |
| Information Manipulation | See Content Manipulation section |
| Inauthentic behaviour | See Platform/Algorithmic Manipulation section |
| Flooding the information space | See Suppression adn Silencing section |
| Derogatory language | See Harmful or Derogatory Speech section |
| Unlabelled political content | Blurs the line between opinion and paid persuasion |
| Suspicious or foreign sponsor IDs | May hide true origin or intent of the campaign |
| Highly targeted messaging | Suggests use of personal data or micro-targeting strategies |
| Sudden surge in similar ads | May indicate orchestration ahead of election events |
2. Investigative workflow: Digital Ad library Analysis
Leverage open ad libraries to investigate political ads and their ecosystem.
Steps:
- Keyword & entity mapping:
- Prepare a list of relevant actors, parties, organisations, issues (sensitive keywords and topics), and locations (e.g. include relevant diaspora countries).
- Search ad libraries using keywords, geolocations (country), and advertiser names.
- Capture ad details:
- Save metadata: platform, run dates, amount spent (if available), impressions, and targeted regions / audiences.
- Save ad screenshots for visual analysis.
- Pivot on selectors:
- Identify linked domains, websites, landing pages, companies, names, emails and phone numbers.
- Check for recurring patterns across ads and viewers.
Ad libraries:
- Meta Ad Library – allows searching by advertiser, keyword, location (country), or format (e.g., image, video)
- Google Ads Library– searchable by advertiser, country, and placement (e.g., YouTube, Google News)
- TikTok Ad Library – covers paid ads with filters by date, country, keywords and advertiser; features ads with at least one impression in the EEA/UK/Switzerland
- Other Libraries – platforms including Bing, Apple, Pinterest and LinkedIn now maintain ad transparency portals under the EU’s Digital Services Act
3. Influencers & undisclosed sponsored content
Many political actors and third-party groups use influencers — from lifestyle vloggers to meme pages — to promote electoral narratives without triggering transparency rules. These are often not visible in ad libraries, especially when:
- Payment is informal (e.g., gifts, access, or future contracts)
- The influencer is not formally part of the campaign
- The content is framed as "personal opinion" or satire
Observers can treat high-reach influencer posts the same way as any other piece of potentially strategic content — especially when it aligns with manipulation patterns (see previous sections).
When you spot political influencer content:
Ask:
| Questions | Why It Matters |
| Does the content align or stand out from the influencer's usual tone? | A sudden shift to political commentary may indicate sponsorship or coordination |
| Is the content part of a larger narrative or moment? | Links to trending topics, election periods, or platform-wide pushes? |
| Is there a disclosure (e.g., #ad, #sponsored, brand mention)? | Lack of disclosure may violate platform policy or national electoral laws |
| Is the same message replicated by multiple influencers at once? | May suggest coordinated push without direct ad payment |
| Has the content reached a wide audience or been amplified? | Check likes, shares, saves, and reposts; assess if reach is significant |
4. Tools & Techniques (OSINT + Open Data)
| Task | Tool / Method | Notes |
| Search ads, capture metadata | Ad Libraries identified above. | Check daily; content may be removed; search in non political ads as well, content may be mislabeled. |
| Capture visuals & URLs | Fireshot, archive.today | Essential for reporting and evidence |
| Trace affiliate domains | Well-Known.dev | Reveals publisher/advertiser link via ads.txt (other connected websites using the same ads system and what ads providers they work with). |
| Investigate linked domains | URLscan.io, Robtex, SecurityTrails | Check domain age, whois, usage pattern |
| Reverse image / content match | Search by image add on, Google Lens, InVID (for videos) |
Check if visuals are used in non-ad content, this is particularly relevant for influencer supported content. |
| Basic company lookup | OpenCorporates, for databases from all over the world UK Overseas Registries, Molfar’s Registry Directory + Google | Useful for tracing sponsors and advertisers. Find out who is behind the company paying for the ad. |
| Check ad trackers and third parties | Who Targets Me (specialised in Political ads with a focused database) CheckMyAds | Advanced tools to explore data sharing & profiling practices |
| Audit ad targeting / Influencer audience | Inspect delivered ad, topics, demographics of the account (if an influencer was used) | Look at the target audience of the ad. Look at the general audience of the influencer. Assess vulnerability to narrative. |
| Map network & attribution | Pivot on domains and advertiser profiles | Link to the investigation methods in the Platform/Algorithmic Manipulation section |
| For influencers - Map other accounts | Use Google search or tools like WhatsMyName to check for other social media accounts by the influencer | Compare content. Has it been labelled as promoted in another platform. Was it only posted in a particular platform. |
5. Assessing influence and attribution
Frame your analysis around 3 key questions:
Who is behind It?
- Identify advertisers as candidates, parties, NGOs, foreign entities, or unknown actors
- Check if the advertiser ID matches email, domain, or account profiles.
- Check who else they are sponsoring and with what kind of ads.
What Is the Message?
- Note narratives, framing, and emotional tone
- Cross-check with content identified in 1 Content Manipulation
- Track issue overlap with harmful or misleading narratives
- Check timing against the legal framework: were any ads run during electoral silence periods or in breach of national rules on online campaigning?
How much influence do they have?
- Spend and impressions (if available)
- Presence across multiple platforms
- Integration with organic content or narratives
- Possible overlap with inauthentic behaviour to push similar non promoted content (see Platform/Algorithmic Manipulation section)
- Use the online impact criteria defined in Phase 3 (reach, engagement, and virality) to distinguish between low-impact and high-impact ad campaigns. For example, a small number of ads with very high impressions or virality may matter more than a larger number of low-reach ads.
6. Best practices & field tips
- Monitor ad libraries regularly — ads are often pulled or expire quickly
- Log metadata and archive visuals — include timestamps, targeting data, and the advertiser’s ID
- Investigate connected content — search for the same visuals or phrases used organically
- Contextualize within influence efforts — connect with trends from content and distribution manipuulation
- Report clearly and objectively — describe the ad’s narrative, targeting, and sponsoring entity, not just its presence
Information manipulation and interference
Information Integrity Relevance
The “Information manipulation and interference” area of assessment focuses on deliberate attempts to distort the online information environment around an election. These practices may involve false or misleading content, inauthentic behaviour, or tactics aimed at silencing certain voices, namely, by the use of hate speech. They can undermine voters’ ability to make informed choices, erode trust in institutions and, in severe cases, disrupt the electoral process itself.
In this toolkit, Information manipulation is operationalised through three complementary chapters:
- Content Manipulation, which looks at deceptive or misleading content and narratives;
- Platform / Algorithmic Manipulation, which covers inauthentic or coordinated behaviour that exploits platform features; and
- Suppression and Silencing, which addresses tactics designed to intimidate, harass or otherwise reduce the visibility of certain actors or viewpoints.
- Deragatory Speech and Hateful content also compromises information integrity, but has wider consequences, and therefore is dealt in a separate area of assessment.
Across all three, the mission’s assessment should be grounded in international standards on freedom of expression and access to information, while taking into account the potential impact on electoral rights and public safety. The general approach to online impact (reach, engagement and virality) and potential to harm is described in the “Phase 3 – General analysis & cross-cutting variables” chapter and in the “Impact and harm assessment across areas” chapter.
The remainder of this page brings together key resources and tools (guides, OSINT techniques, fact-checking networks and research projects) that can support the analysis of information manipulation and, where relevant, of derogatory speech and/or hateful content.
| Subchapter | Observer Prompt | Covers |
| Content Manipulation | “Am I seeing false, misleading, or manipulated content?” | Disinformation, FIMI, manipulated narratives |
| Platform or Algorithmic Manipulation | “Is the way content is being spread suspicious or coordinated?” | CIB, algorithmic manipulation, false interactions, inauthentic accounts, dissemination infrastructure |
| Information suppression | “Is certain speech being blocked, drowned out, or punished?” | Info suppression, censorship, trolling, coordinated silencing |
| Harmful or Derogatory Speech, Gendered Harassment and Bias | “Is the content abusive, hateful, or targeting identity groups?”, “Is this content or behavior targeting women or minorities differently?” | Hate speech, derogatory speech, incitement to violence, Gender-based abuse, online violence, double standards in moderation |
| Political Advertising and Influence | “Is this content paid for? Who benefits?” | Undisclosed ads, microtargeting, foreign-sponsored narratives |
| Operational Security | “How can I do digital investigations keeping myself and others safe?” | Anonymous digital investigation, Ethics in digital investigations, Vicarious trauma |
Content Manipulation
Why It Matters
Content manipulation undermines the integrity of public information during elections. From AI-generated images to selectively edited videos and emotionally manipulative headlines, manipulated content is often designed to mislead, provoke or mobilize.
As election observers, recognizing and verifying such content is vital to prevent misinterpretation, assess the potential to harm, and document its spread in a structured and credible way.
Analysts Question:
“Am I seeing false, misleading, or manipulated content?”
In the context of election observation, this question helps identify content-based threats to information integrity — particularly those involving falsehoods, visual manipulation, or intentionally deceptive narratives.
What is manipulated content?
Manipulated content refers to any post, image, video, or message that distorts facts or context to mislead audiences. It can be:
- Entirely fabricated
- Edited or framed to deceive
- Or shared out of context to manipulate public perception
When this type of content is created or spread with intent and it may cause harm, especially around elections, it can be classified as disinformation.
Disinformation & its role in FIMI
Disinformation is a core tactic of Foreign Information Manipulation and Interference (FIMI) — a concept defined by the EU as:
"a pattern of behaviour that threatens or has the potential to negatively impact values, procedures and political processes. Such activity is manipulative in character, conducted in an intentional and coordinated manner. Actors of such activity can be state or non-state actors, including their proxies inside and outside of their own territory. "
(Source:EEAS)
Disinformation may include things like fake news articles or AI-generated videos, misleading headlines or false claims about the electoral process or political actors.
However, FIMI operations often go beyond disinformation. They may also involve:
- Agenda setting through selective amplification
- Information suppression (e.g. drowning out real content or silencing voices)
- Derogatory or hateful content targeting individuals or groups
- Gender-based information attacks to intimidate or exclude women from public discourse
These additional forms of information interference will be covered in other toolkit sections.
Workflow
To assess whether a piece of content may represent a threat to information integrity, observers can follow a four-step process:
- Identify red flags that suggest possible manipulation;
- Verify whether the content is false, misleading, or taken out of context;
- Assess whether it causes or risks causing harm;
- Measure its reach and virality to determine the level of impact.
1) RED FLAGS — Signs a post may be manipulated
These red flags help observers identify possibly misleading or manipulated content. They are not confirmation of disinformation, but signals that further investigation is warranted.
Watch for these red flags when screening content:
|
Red Flag |
Example |
Explanation |
|
Sensational or alarmist language |
Phrases like “SHOCKING!”, “You won’t believe this!” or all-caps urgency |
Disinformation often uses drama to grab attention and bypass critical thinking |
|
Claims of hidden truth or conspiracy |
“What the media won’t tell you,” “Wake up!” or “The inconvenient truth” |
Disinformation often undermines trust in credible institutions or media |
|
Strong emotional framing |
Designed to provoke anger, fear, pride, or disgust |
Emotional content is more likely to be shared — regardless of accuracy |
|
Unverified or vague sources |
Anonymous authors, references to “experts” without names, or vague “studies”, without links or proper references. |
Lack of source transparency is a hallmark of low-credibility or disinformative content |
|
Attacks on public institutions |
Targeting public institutions, whereas it is the electoral commissions, judiciary, or media as “corrupt” or “foreign-controlled” |
Aimed at eroding trust in the democratic processes |
|
Traditional disinformative narratives |
Recurring narratives common in the digital space of the context you are observing. |
Often reused across contexts and countries with the recycling of not only narratives, but often content itself. |
|
Missing basic information |
No date, location, author, or context for the claim. |
Makes fact-checking difficult and hides manipulation |
|
Screenshot instead of link |
Post uses image of another post, tweet, or news item without linking to original |
May be edited or taken out of context to mislead the audience |
|
Misleading or unrelated visuals |
Images or videos not from the claimed event or manipulated to change meaning, for example, mimicking design of reputable sources. |
Creates a false narrative using visual deception. |
|
Unfamiliar or non-well known sources |
Will link to a news website that has no track record of journalistic work, editorial transparency, for example. |
Very often these campaigns create ‘sources’, like inauthentic news sites, to facilitate content sharing. |
|
Outdated content made to look current |
Old disasters, protests, or speeches repurposed as recent events |
Exploits user assumptions about freshness and relevance |
|
Suggestive framing or visual editing |
Cropped logos, highlighted words, arrows, red circles, exaggerated fonts |
Used to visually steer viewer toward a specific interpretation or bias |
There are other workflows that can help observers determine the manipulative character of content. The most relevant decision is focusing on an analysis framework that applies to the digital ecosystem surrounding the elections and update the red flags accordingly.
2) VERIFY — Is this content false, misleading, or taken out of context?
Once red flags are spotted, the next step is to verify whether the content is manipulated or deceptive. Use a mix of analytical assessments with the support of some simple tools:
Step-by-Step Verification Process
|
Step |
Action |
Tools & Tips |
|
1. Check if the claim has been debunked |
Search for similar claims or narratives in fact-checking databases. |
Google Fact Check Explorer, EUvsDisinfo — enter key terms or quotes. You can also check on local databases. |
|
2. Investigate the source |
Look into the account or outlet that posted the content. Who are they? Are they credible? ⚠️ Be suspicous of anonymous, new, or highly active accounts with low interaction diversity. |
Look for the date of when the account was created. For how long has it been posting content? Does it post about other topics? If it is a Social Media personal account does it have signs of normal human interactions (group photos, family comments, tagged photos etc). For a website check archive.org and who.is to check for history and registration of the domain. |
|
3. Cross-check key information |
Break the content down: names, dates, locations, events. Look for inconsistencies or contradictions. |
Use a search engine for triangulation, focus on finding credible sources. |
|
4. Reverse search the visuals |
See if the image or video has appeared before, in other contexts. Here is a good tutorial. |
Google, Bing or Yandex reverse image search, TinEye or the Search by image add on. For videos, try the InVID plugin. |
|
5. Inspect the media (if available) |
Look for signs of manipulation in images or videos. |
Use InVID to break down video frames. Use Foto Forensics, Forensically and Is it AI to check if a photo has been tampered with. These tools are not 100% accurate. |
|
6. Save before it disappears |
Archive the post or page before it’s taken down. |
Archive.today, Archive.org Use screenshots with visible timestamps as backup. |
Want to go deeper?
Explore the full Verification Handbook — a free, practical guide for verifying digital content, including techniques for geolocation, metadata extraction, and cross-platform analysis. The handbook is available in multiple languages.
Once content has been verified as manipulated or deceptive, analysts should assess its online impact (reach, engagement, virality) and potential to harm using the common framework described in:
- Phase 3 – General analysis & cross-cutting variables; and
- Impact assessment.”
Platform / Algorithmic Manipulation
Observer question:
“Is this content gaining reach or being suppressed through inauthentic or manipulated means?”
- Red Flags: Identify suspicious behaviour
These red flags help observers identify suspicious amplification or suppression patterns. They are not confirmation of inauthentic activity, but signals that further investigation is warranted.
Here are observable signs that the behaviour around a post may not be organic:
| Look at | Red Flag | Why It Matters |
| Interactions | Sudden engagement spike for number of followers | Suggests possible boost by coordinated engagement or automation |
| More shares than likes / comments | Suggests possible attempts to boost content visibility. | |
| Repetitive or generic replies/comments | May reflect coordinated engagement or auto-responses | |
| The accounts interacting have a lot in common (same followers, same posts etc) | Indicates a possible inauthentic cluster working in coordination | |
| Posts get many likes immediately after posting, then stop | May suggest early-stage manipulation (e.g. boosting by botnets) | |
| Accounts interacting have red flags (see below) | May involve use of fake or compromised accounts to manipulate perception of engagement | |
| The content | Identical posts across multiple accounts/channels | Indicates a campaign-style push or copy-paste amplification |
| Multiple accounts posting the same external link (especially shortened URLs) | May be trying to drive traffic to a coordinated destination | |
| Flooding hashtags or comment sections | Aims to drown out visibility or hijack discussions | |
| Hashtag/keyword/sounds trending with low interaction posts | Suggests manipulation of trending algorithms. | |
| Language mismatch. Account language differs from post language, language appears poor translation. | May indicate foreign-controlled or content-recycled accounts. | |
| The account posting / interacting | Frequent posting within seconds/minutes or unusual posting patterns (e.g. with no sleeping breaks) | Often used by bots or centrally controlled accounts. |
| Audience overlap. Different pages/accounts all followed by the same group of users | Suggests use of coordinated audience pools or follower farming. | |
| No profile picture, AI generated picture or innocuous picture (e.g. landscape) | May be a low-effort or fake account used for amplification | |
| Dormant accounts suddenly active | Accounts may have been repurposed for influence campaigns | |
| Recently created account | May indicate fake or disposable accounts created for the campaign period | |
| Account that only posts on a specific topic or with inconsistencies on posting history (e.g. posting on Korean cuisine in english, started posting in arabic on the conflict in Sudan) | Suggests a narrative-focused or non-organic amplification function | |
| Account with no connection to real life - work, family or personal connections in followers / friends | Reduces likelihood of authentic engagement; suggests sockpuppet | |
| Account with no personal activity (e.g. personal comments on their pictures) | Indicates limited or no social behaviour; often used in fake networks | |
| Account with a lot of interactive activity but no posting activity or a lot of followers / friends | Can suggest focus in interaction account, more common in inauthentic behaviour. | |
| Bio mismatch. Profile characteristics, like origin, gender, age do not seem to match language or topics | Suggests use of a fabricated identity or automated profile recycling | |
| Account with no “real life” references (e.g. no group photos, comments on real events etc) | Suggests the account was created to impersonate, amplify or infiltrate, not participate |
NOTE: Before moving to step 2, please do not forget to assess Potential to Harm and Impact before developing a full investigative work. These two assessments and resources and tools to assist are developed in General Analysis section
- Infrastructure investigation: confirming inauthenticity
Once red flags are raised, observers should investigate the underlying infrastructure: accounts, websites, usernames, pictures, or links. These are called selectors — elements that can help link posts to a wider network.
For example, the same email or picture may appear on multiple fake accounts, or a domain used in one post may be reused across pages. Observers can use OSINT tools to check whether the selectors are connected, reused, or behave abnormally.
Common selectors & resources to investigate them
| Selector Type | Goal | Useful Tools |
| Username / Handle | Cross-check identity across platforms, assess for signs of inauthenticity (numbers, sequential). | WhatsMyName, Sherlock, some Custom Google Searches (CSE). |
| Profile Picture | Use reverse image techniques to check for reuse, stock image, AI face | Reverse image add on (Google, Bing, Yandex, Tineye, Baidu) and AI or Not |
| Account or post metadata | Evaluate account age, activity, bio claims, post date. If the account is open, you can always review their posting history. | Tutorial for exact account and post date. This article focuses on Instagram. This video approaches language analysis patterns in digital investigations. |
| Language analysis | Check if the profile language matches the bio. | Chat bots like Claude, ChatGPT or Gemini may help you with an analysis for a language you are not that familiar with. You can use a tool like Zeeschuimer to collect the text of their posts if you don’t want to copy it manually. |
| Account history | Evaluate older posts, specifically the first ones to determine when it started being active. Try to find out if changes were made to the account name. | In Facebook and Instagram, the page / business profile transparency in the about section lets you see if changes were made to the name. You can also check archived versions of the profile in Cached View to see older versions. |
| Domain (URL) | Investigate suspicious websites linked in posts. | Try to find more about the domain, where it is registered, IP, registrant, other connected websites with tools like DNSlytics, Robtex, URLscan.io, Security Trails. Look for archived versions of the website in the Wayback Machine or other archives using cachedview.nl |
| Hashtag / Phrase | Check for simultaneous use or copying | X advanced search, Telegram native search or use tools like TelepathyDB, Facebook, TikTok (mobile) and Instagram (mobile) native search. For Facebook you can also try whopostedwhat and for all of them you can try Google with the boolean search “phrase you want to look” site:facebook.com (change the site according to the platform) |
Practical steps to assess if there is inauthentic behaviour:
⚠️ Reminder: Not every red flag means an account is fake. Use the steps below to collect evidence that supports a confident, proportional assessment.
Step 1: Check cross-platform Identity
- Use the handle to search across Facebook, Instagram, Telegram, TikTok, etc.
- Check username tools to see if it is registered elsewhere, has similar followers/posts and accounts in places that we associate with real people: ebay, tripadvisor etc.
Step 2: Assess visual & bio authenticity
- Reverse-search the profile picture: is it a stock photo or AI face?
- Check account creation date, posting time patterns (24/7?), and follower/following ratio.
- Compare language used to the bio (e.g., ???????? bio with wrong grammatical construction in a lot of posts).
Step 3: Look at account history
- Was it created recently? Or did it only start to post recently? Or did it restart after a long period of silence?
- Are the topics they are now posting on new to this account, does it post or has it posted about anything else? Does the ideas the account defends seem consistent throughout time and with the bio information?
Step 4: Pivot to related assets
- Is the content being interacted with by other accounts? Pick up a sample of interacting accounts and repeat step 1 to 4.
- Is the same content being posted across many accounts? Search the caption or link text.
- If the post links to a website, look up the domain for hosting data, SSL registration, Google Analytics IDs.
- Check if other accounts post to that same domain or reuse its content.
Step 5: Map the Network
- Start mapping the accounts and channels that you analysed using steps 1 to 4.
- Build a selector log: each handle, picture, domain, email becomes a pivot point.
- Use Hunchly or manual Excel logs to track re-use, timing patterns, or overlap between actors.
Step 6: Capture & Archive Evidence
- Archive suspicious posts (Archive.today, Fireshot).
- Screenshot interactions showing spikes, repetitive replies, or copy-pasta text / imaging sharing.
- Save timestamped copies for reference in reporting or escalations.
Optional tools for network or cluster mapping
| Tool | Use |
| 4CAT | Capture and network analysis (advanced) |
| Maltego (free tier) | Link and infrastructure mapping |
| Osint-Combine visualisation tool | Upload .csv table to see connections between nodes |
| Gephi | Also for network analysis |
Inauthentic networks are usually very closed and connected between them, reposting content and interacting between themselves, not having a lot of connections besides their network or the topic that are posting / interacting with.
- Assessment questions to confirm inauthentic behaviour:
Before escalating a case of inauthentic behaviour, it's essential to evaluate whether the manipulation has meaningful relevance to the electoral context. Not all coordinated activity is harmful — for instance, spammy networks selling products or posting entertainment content may show classic signs of inauthenticity, but pose no threat to electoral integrity. Use the following questions to assess whether suspicious behaviour is likely part of an operation that affects trust, participation, or perception. Always connect this analysis to your earlier Potential to Harm and Online Impact Assessment (see section on General Analysis).
| Assessment Question | What to Look For (Indicators) |
| Does the content appear to be amplified inorganically? |
|
| Are multiple accounts posting similar or identical content? |
|
| Are the accounts part of a closed network? |
|
| Do the accounts show signs of fake or automated identity? |
|
| Are external assets (websites, links) reused or clustered? |
|
| Is this consistent with past or known influence behaviour? (Advanced) |
|
A Note on attribution
Observers should avoid jumping to conclusions about who is behind a campaign. Attribution (linking a network to a political or foreign actor) requires technical forensics beyond the scope of Election Observers. However, your goal is to assess whether the content’s reach or suppression appears manipulated — and to report patterns that merit further attention by the core team or analysts.
Suppression and Silencing
Observer Question
“Is this content or actor being silenced or drowned out to suppress legitimate voices?”
This chapter helps observers identify and investigate information suppression tactics — coordinated efforts to reduce the visibility, accessibility, or perceived legitimacy of certain actors or messages online. Information suppression differs from regular moderation: it becomes problematic when it is used to silence voices disproportionately, strategically, or in bad faith — often through mass reporting, cyberattacks, platform gaming, or harassment. and its tactics, such as mass reporting, coordinated cyber‑attacks, or platform-enforced exclusions.
- Common suppression tactics
There are a wide range of suppression strategies. Observers may encounter one or several of these tactics used simultaneously:
|
Tactic |
How It Works |
Examples |
|
Mass reporting |
Coordinated complaints to platforms to remove accounts or posts |
Journalists or observers suddenly banned after criticism |
|
Algorithmic demotion |
Tag flooding or hijacking to bury legitimate content in irrelevant results |
Electoral commission hashtags spammed with memes |
|
Cyberattacks (DDoS, hacking) |
Make key websites inaccessible or deface their content |
Candidate website or observer blog taken down day before election |
|
Narrative hijacking |
Seize popular hashtags or keywords and inject discrediting or unrelated content |
#NoElectionNoPeace used for spam or violent memes |
|
Trolling and harassment |
Intimidate actors to self-censor or withdraw from public discourse |
Coordinated abuse campaigns targeting women candidates or observers |
- Field implementation tips
- Identify and list key accounts or platforms (e.g. electoral bodies, candidate pages, journalist accounts) that are more likely to be targeted. Prioritise them for monitoring during high-risk periods.
- Monitor key accounts actively — note any changes or disappearance.
- Build a baseline for normal visibility and interaction rates.
- Collect contextual evidence — platform statements, community alerts, archive snapshots.
- Classify and prioritise key targets for monitoring, for example:
- High priority – electoral commissions, official observers, political candidates;
- Medium priority – journalists, civic groups, community representatives;
- Lower priority – non-influential or purely satirical accounts.
- Red Flags: Signs of targeted suppression
These red flags help observers identify suspicious suppression patterns. They are not confirmation of information suppression but signals that further investigation is warranted.
|
Red Flag |
Why It Matters |
|
Major accounts get deleted or banned suddenly |
May be due to mass reporting or coordinated removal |
|
Mass follower loss overnight |
Suggests account purging triggered by platform |
|
Hashtag or keyword suddenly hidden |
Could be demoted or shadow‑banned by the platform |
|
Narrative gets shifted |
May indicate coordinated hijacking or flooding of a topic to discredit or drown out a legitimate narrative |
|
Information channels become inaccessible |
Could be under cyber‑attack or facing blockages |
|
Reports of DDoS, hacking, or website defacement |
If done on official and/or trusted sources, can be an information suppression attack |
Risk assessment by country
Information suppression tactics are a broader concern in countries in which governments have a history of pressuring platforms and using the country's telecom infrastructure to reduce access to online content.
Not All content removal = suppression
Suppression should not be confused with legitimate platform moderation. Removing hate speech, incitement, or false information under platform rules is not suppression. Observers should only flag actions as suppression when they appear targeted, disproportionate, or manipulative.
- Investigating suppression tactics
Once suppression red flags are observed, the next step is to identify how suppression is being carried out — through platforms, coordinated behaviour, or infrastructure. The techniques below can help confirm whether information is being strategically limited, removed, or hidden.
Mass reporting & account removal
- Track if key political figures, electoral authorities, or journalists suddenly lose access to accounts or disappear from Social Media platforms / searches. Try to map if this has happened isolatedly or across multiple accounts / platforms.
Shadow-banning, demotion & visibility reduction
- If post engagement drops drastically for a key figure / topic, test reach by:
- Following the same profile / topic from a clean/test account with no prior interaction.
- Comparing visibility on different browsers/devices or using incognito mode.
- Testing visibility from VPNs in different countries (may reveal regional suppression).
- Compare reach against content of similar accounts or topics.
Cyber attacks (DDoS, Hacking, Defacements)
- You can use Downdetector to check real-time reports of service disruptions.
- You can set up external website monitoring for electoral bodies, candidates, or key institutions:
- UptimeRobot (free plan): Monitors websites for availability and downtime. Sends alerts via email when a site becomes inaccessible — a key indicator of a potential DDoS attack.
- Visualping: Tracks visual changes on websites and alerts if defacement or text manipulation is detected.
- Fluxguard (free tier): Monitors for deeper structural and content changes, ideal for detecting subtle or script-based defacements
- If you suspect defacement, use org or Archive.today to compare the current and past versions of the site. Take fresh snapshots immediately if the page is still live. Check if there is a disinformation campaign leading users to the defaced website (track recent mentions to this website on Social Media).
TIP: If a key site goes down just before an election, a results announcement, or a political event, document timing and check if other sites or platforms are affected — this can suggest intent to suppress access to credible information.
Infrastructure-level blocking or platform restrictions
- In countries where the government has telecom control, entire websites or platforms may be blocked or throttled.
- Check access to websites or platforms through:
- VPN testing (compare access from different regions)
- Global censorship monitoring tools like OONI Probe or Censored Planet
TIP: Watch for announcements or leaks about “temporary” bans on certain websites or messaging platforms, social media platforms, or foreign news outlets in the days upcoming the election — often framed as national security or misinformation control, but could be used to suppress.
Harassment, threats & fear-based suppression (see Hateful Content section)
While often associated with harmful speech, harassment can also be used to intimidate actors into silence.
- Track reports of online abuse from women candidates, election workers, journalists.
- Investigate if posts have been deleted after sustained targeting (DMs, mentions, replies).
- Save examples of language used: are people being told to "shut up", "go away", "you’ll regret speaking out"?
Connection to the Hateful Conent section: These emotional or social forms of suppression are part of the broader campaign to remove voices from the public space — not by deleting their content, but by pressuring them to self-censor.
Documenting evidence:
As with other sections, but particularly with suppression, archive all evidence—screenshots, logs, timestamps, archived pages. Tag each with incident ID, time of detection, and risk assessment.
- Risk assessment
There are a number of other variables to include when doing a risk assessment towards a possible case of information suppression:
- Was it automated platform action (e.g., algorithm/datacenter fault)? See Platform/Algorithmic Manipulation section
- Or does it appear coordinated and targeted (e.g., repeated reports, or hacked content)? See Platform/Algorithmic Manipulation section
- Evidence of external targeting, like synchronized defacements, suggests an attack on free speech.
- Assess the harm (e.g., who is silenced) and the impact (e.g., who benefits) - for this see section on General Analysis.
These factors should not be evaluated in isolation. But when patterns of targeting, manipulation, and potential harm intersect, a strong case of suppression emerges — and may warrant escalation, reporting, or public clarification.
Hateful Content
Observer question
“Is this speech attacking people on the basis of who they are – and is it being used to intimidate, exclude or distort participation in the election?”
This chapter supports observers in assessing when hostile, insulting or discriminatory speech crosses into derogatory speech and/or hateful content that is relevant for the mission. It is particularly important when such content is part of a broader effort to intimidate, silence, or influence electoral dynamics.
For the purposes of this toolkit, this area includes in particular:
- Identity-based derogatory speech and/or hateful content targeting individuals or groups on protected grounds (e.g. religion or belief, ethnicity, nationality, race, gender, sexual orientation, disability, age or other identity factor).
- Attacks against candidates and other political actors based on identity, including narratives that question their legitimacy or equal participation because of who they are.
- Gendered and intersectional harassment campaigns, especially against women and members of marginalised communities.
- Strategic use of slurs, dehumanising language or calls for exclusion to mobilise supporters, suppress participation, or undermine equal political rights.
When in doubt, analysts should always come back to the central idea: hate speech is identity-based. Hostile political language that does not rely on identity factors may still be problematic, but usually belongs under other areas (e.g. violent communication, defamation, or general campaign tone).
From post to pattern: where is the harm?
Most concerning cases of derogatory or hateful content are not isolated one-offs. They become a serious issue when they show patterns:
- repeated over time,
- echoed by multiple accounts or communities,
- connected to other forms of manipulation (e.g. disinformation, artificial amplification, suppression).
Instead of focusing only on single offending posts, observers should ask:
- Is this theme, target or slur appearing again and again?
- Is it linked to false or misleading narratives (see Content manipulation)?
- Is it being amplified or coordinated in suspicious ways (see Platform / algorithmic manipulation and Suppression and silencing)?
Use the online impact and potential-to-harm variables from Phase 3 to decide which patterns deserve deeper investigation and space in mission reporting.
Hateful content indicators: protected ground and type of expression
Before going into campaigns or networks, analysts should quickly answer two content-level questions for any suspected case.
Protected ground – who is being attacked?
Check whether the content targets a person or group because of who they are, for example on the basis of:
- religion or belief
- ethnicity or race
- nationality
- language
- gender or gender identity
- sexual orientation
- disability
- age
- other clearly identity-linked factor (e.g. descent, caste, indigenous status)
If there is no identity element, the content may still be hostile or problematic, but it is usually not hate speech and should be coded under other categories (e.g. general negative campaigning, defamation, or violent communication).
Type of expression – how is the attack framed?
Then look at how the identity-based attack is expressed. Common types of expression include:
- Slurs and insults linked to identity
- Dehumanisation (portraying people as animals, pests, disease, “vermin”, etc.)
- Negative stereotypes and scapegoating (“they are criminals”, “they steal elections”, “they are dirty”, “they spread disease”)
- Denigration / vilification of a group’s dignity or worth
- Harassment and stigmatisation (sustained targeting, humiliation, calls to shame or ostracise)
- Threats or calls for exclusion (“they should be expelled”, “they cannot be allowed to vote”, “they should not be in politics”)
- Calls for discrimination or violence (including celebration of past violence)
- Manipulated or deceptive content with hateful framing (e.g. edited video or fabricated quote that portrays a minority as dangerous)
Severity of expression
Missions can also apply a simple three-level severity scale to identity-based content:
– Level 1 – hostile or derogatory expression, including slurs and demeaning stereotypes;
– Level 2 – advocacy or normalisation of discrimination or exclusion;
– Level 3 – advocacy or celebration of violence.
This scale helps distinguish between content that ‘only’ insults or stigmatises and content that calls for exclusion or violence.”
These indicators help distinguish identity-based hate from simply harsh or uncivil political debate.
Special focus: gendered and intersectional harassment
Gender-based and intersectional attacks often have specific forms and consequences. They can target:
- women candidates and officials,
- women journalists and activists,
- LGBTQ+ persons,
- people at the intersection of several protected grounds (e.g. minority women, disabled women, trans candidates).
Common patterns include:
- Sexualised or gendered insults (“whore”, “slut”, “too ugly / too pretty to be taken seriously”).
- Attacks on appearance, family roles or private life, rather than political positions.
Claims that women or LGBTQ+ persons are “unfit” for public office or should “stay at home”. - Memes that objectify, mock or dehumanise women and other marginalised groups.
Campaigns that frame women’s speech as illegitimate, foreign-driven or morally corrupt.
In these cases, observers should:
- Track the volume and tone of mentions targeting these actors.
- Save examples of visual content (memes, edited photos, deepfakes) that rely on gendered or sexualised humiliation.
- Note double standards (e.g. behaviour tolerated in male actors but condemned in women, or identity factors raised only for some candidates).
These attacks are often directly connected to suppression and silencing: the goal is not just to insult, but to push people out of public life or deter them from participating.
Narrative mapping – from isolated speech to a campaign
Once you have identified identity-based, derogatory or hateful content, the next step is to see whether it is part of a wider narrative.
You can reuse the same approach described for information manipulation:
|
Step |
What to do |
Typical tools / sources |
|
Identify targets and slurs |
Note the key slurs, stereotypes, or identity references used against a group or person. |
Your mission’s lexicon, past incidents, local language know-how. |
|
Search across platforms |
Look for repeated uses of the same terms, slogans or memes on other platforms and in different communities. |
Platform search (X, TikTok, Facebook, Instagram, Telegram), Google site: searches, tools like WhoPostedWhat (Facebook). |
|
Trace visuals |
Check whether the same meme, image or video is being reused with hateful captions or framing. |
Reverse image search, InVID for video frames. |
|
Build a timeline |
When did the narrative first appear, and when did it spike? How does this line up with key electoral events? |
Spreadsheets, simple timelines, archives / screenshots sorted by date. |
Example: a meme comparing Haitian migrants to animals appears first in fringe groups, then spreads to larger pages and influencers, and is finally used in a speech by a political actor. This evolution should be documented as a narrative, not as isolated posts.
Is it being amplified or used strategically?
Derogatory or hateful content becomes more significant when it is:
- amplified inorganically (e.g. same message pushed by many suspicious accounts),
- used to drown out or discredit legitimate actors and information, or
combined with other manipulation techniques (disinformation, platform gaming, suppression). - Is expressed by a high-weight figure - note who is speaking (candidate, party account, media outlet, influencer, civil society actor, citizen, suspected bot/network). Power imbalances matter: similar wording by a senior political actor generally carries more weight than by a low-reach anonymous user.
When you suspect a narrative or set of posts is part of a deliberate effort:
- Check for simultaneous posting by many accounts using the same slurs or slogans.
- Look at whether high-risk content (e.g. calls for exclusion or violence) is being reshared by accounts with red flags (see Platform / algorithmic manipulation).
- Note whether comment sections or hashtags around the target are being flooded with insults or harassment, making normal conversation impossible.
You do not need to prove full coordination or identify the actor behind it. For the mission’s purposes, it is enough to show that identity-based attacks are being used in a way that can distort participation, intimidate, or silence specific groups, and to document the main observable patterns.
Assessing harm and deciding what to escalate
The detailed online impact and potential-to-harm assessment is introduced in Phase 3 and in the “Impact and harm assessment across areas” chapter. For derogatory speech and/or hateful content, you can apply those cross-cutting variables using a few area-specific questions.
Types of harm specific to this area
When reviewing a case or narrative, consider whether it shows signs of:
|
Type of harm |
What to look for |
|
Incitement to violence or exclusion |
Calls for physical harm, expulsion, deportation, or explicit denial of rights (“they should not be allowed to vote / run / speak”). |
|
Suppression through intimidation |
Threats, mass tagging, harassment campaigns or dog-whistles that are likely to push targets offline or make them self-censor. |
|
Identity-based hate and stigmatisation |
Repeated targeting of a group based on protected grounds, using dehumanising or vilifying language. |
|
Weaponisation of hateful narratives |
Reuse of hateful tropes to support disinformation, to delegitimise parts of the electorate or to undermine equal participation. |
When to treat a case as higher priority
Combine three elements when deciding what to escalate:
– the severity of the expression (insult vs call for discrimination vs call for violence);
– the online impact and breakout (see Phase 3 and Impact & harm chapters);
– the initial potential to harm (low / medium / high).
Cases that involve Level 2–3 severity, target protected groups, and show at least medium potential to harm will normally merit higher priority.
Analysts can also treat hate-related cases as particularly serious when:
- The content targets vulnerable or historically marginalised groups and is linked to protected grounds.
- The narrative shows repetition and spread across accounts, communities or platforms.
- There is evidence of artificial amplification or suppression, as described in the Platform / algorithmic manipulation and Suppression and silencing chapters.
The case coincides with sensitive electoral moments (e.g. just before voting, during results announcement, or around key rallies).
For such cases, make sure to:
- Archive posts and visuals (screenshots, links, timestamps) - see tools and techniques for this in this Toolkit.
- Record who is targeted, which protected ground is involved, and what type of expression is used.
Add a short note on why the case is considered to have medium or high potential to harm, using the general examples and scale in Phase 3.
Impact Assessment
This Toolkit chapter is used after the mission has already identified and investigated relevant cases during Phase 3 – General analysis & cross-cutting variables.
- In Phase 3, the SMAs perform an initial screening of posts, ads, narratives and incidents:
- applying online impact (reach, engagement, virality) and potential to harm at the content level;
- deciding which cases deserve further investigation (OSINT checks, narrative tracking, network analysis, etc.).
- In this chapter, the mission carries out the final impact and harm assessment, once that investigative work has been done and the case is seen in its full context (narrative, network, offline effects).
The purpose is to help SMAs answer, for each major case or narrative that survived the initial screening:
- How big was its real impact in the information environment and across platforms?
- How serious was its potential to harm electoral rights, participation, equality or safety?
- How should this be reflected in the mission’s findings and reporting?
To do this, we will:
- reuse the post-level online impact and potential harm concepts defined in Phase 3;
- adds tools for assessing narrative-level impact and breakout (across platforms, media and audiences);
- integrates external reference models (such as the Breakout Scale and impact-risk approaches); and
- proposes a simple priority grid to decide which cases become key findings in preliminary and final reports.
In other words, Phase 3 tells the analyst what to look at more closely; this chapter helps the mission decide what ultimately mattered most for the election and to objectively report on the impact of SMM findings.
Here, the goal is to make a data based judgement on:
- how much these cases mattered in the information environment, and
- how serious their potential to harm electoral rights, participation, equality or safety was.
The assessment is done not just on single posts, but on three types of “cases”:
- Narratives – recurring storylines or claims.
- Actors or networks – accounts, pages, sites or coordinated clusters (including bots) that drive influence.
- Campaigns – combinations of content, ads and tactics used for a specific objective.
Define the case: narrative, actor/network, or campaign
Before assessing impact and harm, clearly define what you’re evaluating. A “case” can be:
- A narrative
- e.g. “The election is rigged”;
- e.g. “Candidate X is a thief and always corrupt”;
- e.g. “Country X immigrants are dirty / live like animals”;
- An actor or network
- a single account or page with outsized influence;
- a bot network amplifying multiple narratives against opponents;
- a cluster of websites recycling the same misleading or hateful content;
- a set of accounts used to mass-report or harass specific targets.
- A campaign
- a coordinated set of posts and/or political ads around a specific goal:
- promoting one contestant,
- attacking an opponent,
- pushing a manipulation narrative,
- targeting a specific community.
- a coordinated set of posts and/or political ads around a specific goal:
The final impact and harm assessment should be done at this case level, with post-level data used as evidence (please see content saving tools / archiving tools in the Tools & Techniques section of this toolkit).
Narrative / actor / network mapping (what you are measuring)
For each case, make sure you have a clear map before judging impact:
If it is a narrative
- Write a short label + description.
- List the keywords, hashtags, slogans and key phrases.
- Identify typical visuals (memes, screenshots, images) associated with it.
- Link it to the Phase 1 sensitive topics and to the relevant area(s) (e.g. information manipulation, derogatory speech and/or hateful content).
If it is an actor or network
- Identify the main accounts/pages: name, platform, type (official contestant, influencer, anonymous page, etc.).
- Identify related accounts: bots, supporting pages, repeat amplifiers.
- For networks:
- sketch the cluster structure (closed group of accounts, hub-and-spoke around one main account, multiple hubs, etc.);
- note whether it is tied to a specific narrative or pushes multiple narratives (e.g. a botnet attacking several opponents and promoting one).
If it is a campaign
- Define the objective (promote, discredit, mislead, mobilise, suppress).
- List channels used:
- organic posts,
- political ads,
- websites,
- messaging apps,
- email/SMS (if known).
- Place it in the timeline (start/end, peaks around key electoral moments).
To keep the investigation transparent and reproducible, the mission may use a simple “observables table” or log (for example, an Excel sheet) listing all posts, accounts, pages and websites associated with the case, together with basic fields such as date, platform, actor, narrative tag and online impact band. This builds on the “selector log” practice described in the Platform / Algorithmic Manipulation chapter, where each handle, picture, domain or email is treated as a pivot and logged systematically. The observables table then becomes the main reference when assessing impact and harm at case level.
Impact: spread and breakout beyond individual posts
Now assess how far the case went. This combines:
- Narrative-level spread (for narratives),
- Actor/network-level reach (for actors or coordinated clusters),
- Campaign footprint (for mixed cases).
Narrative-level impact and breakout
Use your mapping (observables table if you built one) to see how the narrative spread:
- Over time (before/during/after key events).
- Across platforms (Facebook, X, TikTok, Instagram, YouTube, Telegram, etc.).
- Across communities (different political camps, regions, language groups).
- Across media (did it reach mainstream media?).
- Into elite discourse (did high-profile figures amplify it?).
- Into offline / institutional space (protests, policy statements, official decisions).
Actor / network-level impact
For actors or networks, look at:
- Audience size (followers, subscribers, newsletter lists).
- Typical and peak engagement:
- average interactions per post;
- outlier posts;
- how often their content falls into high/viral impact bands.
- Diversity of narratives:
- do they focus on a single storyline or push multiple coordinated narratives?
- Cross-platform presence:
- same actor/brand across platforms;
- network of pages or channels that share content systematically.
- Role in breakout:
- are they originators of the narrative, or secondary amplifiers?
are they crucial for the narrative jumping platforms or reaching new communities?
- are they originators of the narrative, or secondary amplifiers?
Coordinated botnets or site clusters can have high impact even if each single account looks small. If the network together ensures that certain narratives dominate attention or that certain actors are consistently attacked or silenced, their network-level impact should be considered high.
Impact assessment
This final step is applied only to cases that have already been investigated (narratives, actors/networks or campaigns) and flagged as relevant in Phase 3 and mapped using the steps identified above. The goal is to answer, in a structured way:
“Did this really have a meaningful impact on the election, and how serious was the potential harm?”
The assessment combines:
- online reach and engagement of the case;
- who it reached (relevant audiences or just small niches);
- how far it broke out beyond social media; and
what type of harm it likely caused.
Estimate overall online reach
Using the data collected during monitoring and investigation and mapping, estimate how widely the case - combination of posts on a narrative, combination of posts by a network of bots or inauthentic sites, combination of posts within a campaign - could have been seen online. Use the best available metrics:
- views / impressions (when available);
- interactions (reactions, comments, shares);
- follower / subscriber counts of key accounts or channels;
- traffic to key websites (if known).
The estimate does not need to be exact, but it should be conservative and documented. Where possible, relate it to the size of the online population and/or electorate:
- Limited reach – plausibly well below 1% of internet users / voters.
- Moderate reach – roughly 1–10% of internet users / voters.
- Broad reach – plausibly over 10% of internet users / voters, or sustained, repeated exposure among a key electoral audience.
If national statistics for internet users or voters are not precise, a rough estimate based on platform penetration and audience data is acceptable, as long as the assumptions are noted.
Look for breakout beyond the online niche
You can place the analysed case on an adapted breakout ladder (Ben Nimmo’s Breakout scale):
- Contained niche – stays in a small online community on one platform.
- Cross-platform or cross-community – spreads to multiple communities on one platform, or to several platforms within one camp.
- Multi-platform, multi-community – appears on several platforms and in different communities.
- Cross-medium breakout – picked up by mainstream media.
- Elite amplification – repeated or endorsed by major political, institutional or social figures.
- Real-world or institutional effect – linked to protests, violence, policy responses or explicit mentions in official decisions.
Re-assess harm with full context
Finally, revisit the potential to harm assessment, but now with the full picture of the case:
- Who was targeted or affected (voters, candidates, women, minorities, EMB, observers, journalists)?
- Which rights and guarantees are at stake (participation, equality, safety, freedom of expression, access to information)?
- Did the case contribute to:
- misinforming voters about procedures or eligibility;
- discouraging participation;
- normalising hatred, dehumanisation or discrimination;
- pressuring people into silence (self-censorship);
undermining trust in the electoral process or institutions?
Use the same three levels defined in Phase 3 (low / medium / high potential to harm), but now applied to the case as a whole, not to individual posts.
Final judgement: did it matter?
Combine the three dimensions:
- Overall online reach (limited / moderate / broad),
- Breakout beyond social media (none / some / clear),
- Potential to harm (low / medium / high),
to make a simple final judgement:
- Major impact case
- Broad or sustained reach and
- clear breakout beyond a niche (media, elites, or offline events) and/or
- high potential to harm electoral integrity, participation, equality or safety.
- → Should be treated as a key finding and reflected in main conclusions.
- Significant impact case
- Moderate to broad reach or clear breakout and
- medium potential to harm.
- → May deserve mention as an important example or secondary finding.
- Limited impact case
- Limited reach, confined to small niches, and
- low potential to harm, with no clear breakout.
- → Can be kept in internal records, but usually does not require space in public reporting.
The key point is that, at this stage, the mission is no longer asking whether a single post was big or small, but whether the overall case – narrative, actor/network or campaign – had enough reach, breakout and harm to matter for the election and therefore to appear in the mission’s findings.
Privacy and Safety during SMM
Expert Question:
“Am I conducting digital investigations safely, ethically, and with care for myself and others?”
This chapter offers guidance on how to protect your identity, respect privacy, and minimise emotional harm when dealing with harmful or sensitive online content during election observation missions.
1. Staying anonymous in digital investigations
When election observers visit websites, social media pages, or profiles (e.g., Instagram Stories, LinkedIn, TikTok), their presence can often be detected by the people or platforms they are investigating.
What risks exist?
- Instagram Stories show viewers to the account owner
- LinkedIn profiles log who viewed them
- Websites may collect IP address, visit time, mouse activity, downloaded files, and screen resolution
- Persistent cookies or browser fingerprinting can track you across visits
Tips & Tools for safe viewing
| Method | Use Case | Tools / Examples |
| Third-party viewers | Watch Instagram stories or TikTok posts anonymously | These tools keep changing but search on google for anonymous instagram / tiktok viewer. Do not log in. |
| Archives / cached views | Visit a site without alerting the owner. Look for archived version or request archiving. | archive.today, archive.org, cachedview.nl |
| Private browsing with VPN & anti-fingerprint browser | Reduce traceability during live viewing. Create a digital footprint that looks ‘normal’ to the online spaces you are visiting. | Check your digital footprint at WhatsmyIP.org and CoveryourTracks. |
⚠️ Important: Do not create accounts impersonating or using false personal details. For general monitoring, always seek IT/security team guidance.
2. Ethical Boundaries in Open Source Research
Digital investigations must balance public interest with ethical responsibility. Observers are not just looking for content — they are working with potentially sensitive, personal, or private data.
Key ethical principles (based on Obsint.eu Guidelines)
- Respect expectation of privacy: Just because something is technically visible doesn’t mean it’s ethically usable
- Avoid unnecessary exposure: Blur names/faces in reports unless necessary for mission aims
- Be cautious with data leaks: Avoid sharing or storing content from leaks containing personal identifiers or sensitive documents
- Protect minors and vulnerable individuals: Never screenshot, share, or analyse content involving children or exposed individuals without justification and redaction
- Context matters: A joke in one culture may be a threat in another — always interpret within context.
Remember, digital research during elections is part of a democratic process. Treat your subjects, even the ones you disagree with, with neutrality and restraint.
3. Vicarious Trauma in online monitoring
Observers may encounter disturbing or hateful content: threats, racism, sexualised abuse, memes mocking violence, or gendered attacks. Prolonged exposure can cause vicarious trauma — a real psychological impact of witnessing harm second-hand.
Signs you might be affected:
- Difficulty sleeping, hypervigilance
- Emotional numbness or outbursts
- Avoidance of certain content or denial of its impact
- Headaches, anxiety, or exhaustion after sessions
How to protect yourself
| Technique | What to Do |
| Create a “trauma hygiene” routine | Set time limits, take regular breaks, avoid working late |
| Use distancing tools | View disturbing content in thumbnail mode or grayscale, reduce sound |
| Limit repeated exposure | Don’t rewatch harmful videos — one viewing is enough for evidence |
| Debrief and talk | Have a trusted colleague or supervisor to debrief with — isolation increases trauma risk |
| Take breaks after exposure | After processing harmful content, step away to reset your emotional baseline |
Traditional Media Monitoring
Legacy Media and Elections
For there to be a genuine democratic electoral process, it is essential that candidates and political parties have the right to communicate their messages so that voters receive a diverse range of information necessary to make an informed choice. The media play a central and influential role in providing candidates and parties with a stage to engage voters during an election period.

In this respect, the media will often be the main platform for debates among contestants, the central source of news and analysis on the manifestos of the contestants, and a vehicle for a whole range of information about the election process itself, including preparations, voting and the results, as well as voter education. The media therefore have a great deal of responsibility during election periods, and it is essential that they provide a sufficient level of coverage of the elections that is fair, balanced and professional, so that the public is informed of the whole spectrum of political opinions as well as of the key issues related to the electoral process.
Media regulation during the electoral process may take different forms, ranging from a pure self-regulatory model to co-regulation or statutory regulation. Whatever the approach adopted for media coverage rules, it is important that the normative framework does not unduly restrain freedom of the media, and that it allows for a prompt resolution of complaints.
EOM Media Monitoring
The EU Election Observation Mission (EOM) assesses the role of the electronic and print media during the election campaign using a quantitative and qualitative methodology. This assessment considers the following key aspects:
- whether political parties and candidates are given fair and equitable access to the media;
- whether political parties and candidates are covered in a balanced and unbiased manner;
- whether the media and the authorities adhere to the rules on coverage of an election campaign;
- whether the media give sufficient coverage of electoral issues to provide for the electorate making an informed choice on election day. If not, the reasons for this are considered;
- whether public (state-owned) media fulfil their specific obligations.
The media monitoring methodology used by EU EOMs produces a quantitative and qualitative analysis of the distribution of media time and space given to each political contestant, and the tone of coverage. The results are analysed in the context of the specific media environment, including the regulatory framework and the overall coverage of the election.
The Media Analyst (MA) should be familiar with the media landscape of the country before deciding which media outlets are monitored. Those selected should include state/public and privately-owned media outlets, and ensure a varied balance taking into account, for example, political leanings and target audiences. Media aimed at minorities should be considered for monitoring, and the geographical balance of the regional media should also be taken into account.
For broadcast media, the media analyst normally monitors all programmes during prime time broadcasts. Television and radio programmes are recorded and stored by the EU election missions for this purpose.
The methodology involves the measurement of the coverage given to individual political actors: candidates and political parties, heads of state, heads of government, ministers, members of parliament as well as local authorities and representatives of political parties. The data collected for the quantitative analysis include: date of coverage, media outlet, time coverage starts, duration, programme type, gender of individual political actor being covered and issue covered. Coverage is measured in seconds of airtime or square centimetres of print-space devoted to each individual and political party. Access time/space, when political actors have direct access to media is also measured.
The quantitative analysis also assesses the tone of the coverage, i.e., whether it is neutral, positive or negative. This is measured by taking into account a number of elements, including whether journalists express explicit opinions on a political actor and the context in which the political actor is covered.
The methodology also includes a qualitative analysis of media election coverage. EU EOMs focus on several key areas of observation, including::
- Use of hate speech or inflammatory language.
- Adherence to professional journalistic standards, such as accuracy, balance, and avoidance of bias, defamation, or partisanship.
- Selective reporting or omission of significant news.
- Media bias or preferential support for particular parties or candidates.
- Abuse of incumbency or institutional advantage during the campaign.
- Respect for campaign silence rules and legal provisions on opinion or exit polls.
- Media coverage of the EMB and its impact on public confidence.
- Quantity and quality of voter education content.
- Formats used for election coverage (e.g., debates, interviews, talk shows).
- Representation of women and minorities, including the presence of stereotypes and the use of minority languages where relevant.
- The role and influence of online media in election coverage.
In the age of digitalisation, software products with advanced technical solutions are currently used during Traditional Media Monitoring Activities as they guarantee methodological integrity, ensure consistency of methods across EOMs, promote transparency and accountability and enhance confidence on the overall tasks of MAs.
Media Monitoring Guidelines


Available tools & techniques
Social media monitoring has developed into a broad and rapidly evolving research field, with a wide range of tools and techniques currently available on the market. The aim of this section is to illustrate the diversity of tools that experts can use today, while also providing guidance for election observation contexts.
The categories in the table below include social listening tools, data visualization tools, network analysis tools, ads monitoring tools and other tools.
To ensure operational relevance and methodological consistency, a comparative study was conducted to narrow this wide landscape to a set of tools that have proven suitable in EU missions, based on EODS research and feedback from Social Media and Media Analysts deployed between 2021 and 2025.

The tools recommended and successfully used in more than 30 missions include CrowdTangle ( provided to EU EOMs SMAs and MAs from 2021 to 2024, until Facebook decided to discontinue the tool), SentiOne, Gerulata, Who Targets Me, IMAS and DataWrapper.The Tools were selected for their user-friendliness, operational and analytical suitability, platform coverage, price, quality and data origin, and the availability and responsiveness of support.
| 4Cat Difficult |
Social Listening |
Open source tool to collect datta from several social media platforms via API or scraping. Includes: 4Chan, Telegram, Tumblr, Instgarm, TikTok, Linkedin, Twitter, etc. Requires your own server.
|
Free/Open Source |
| Bot Sentinel Easy |
Other tools |
Tool developed by Christopher Bouzy in 2018 to track disinformation and harassment on Twitter. Currently with limited functionality | Free/Open Source |
| Botometer Easy |
Other tools |
Tool developed by Indiana University (USA) to assess probability of Twitter user being a bot. Not active for data after June 2023 | Free/Open Source |
| Brand 24 Medium |
Social Listening |
Monitoring X, Facebook, Instagram, YouTube, Linkedin, Reddit, Telegram, TikTok, web, blogs, foruns | Paid |
| Brandmentions Medium |
Social Listening |
Monitoring most important social media channels. | Paid |
| Brandwatch Medium |
Social Listening |
Monitoring most important social media channels. Twitter and Linkedin are partners. | Paid |
| BuzzSumo Medium |
Social Listening |
Monitoring Facebook, Twitter, Reddit, Pinterest,Instagram, YouTube, TikTok, Web, blogs | Paid |
| Communalytic Medium |
Social Listening |
A computational social science research tool for studying online communities and discourse. Includes access to Bluesky, CrowdTangle, Mastodon, Reddit, Telegram, X (via authorized API), and YouTube. May also uload CSV data. Performs network analysis, sentiment analysis and toxicity analysis. | Freemium |
| Cyclops Medium |
Social Listening |
Scraping tool for Telegram, Twitter, and VK. Additionally, RSS-based method to gather data from general sources such as websites, blogs, Facebook, and TikTok. | Paid |
| Data 365 Difficult |
Social Listening |
Monitoring Facebook, Instagram, Twitter/X, other with API | Paid |
| Datareportal Easy |
Data Source |
Compilation of data on internet and social media, worldwide and per country. Info on most countries in the world | Free/Open Source |
| Datawrapper Easy |
Data Visualization |
Upload and visualize data using visualization templates | Freemium |
| Digital News Report Easy |
Data Source |
Internert and social media use stats on 47 countries | Free/Open Source |
| E-Monitor + Easy |
Social Listening UNDP |
Developed by UNDP to Monitor Facebook; Instagram; Twitter; YouTube, News, Etc | Free/Open Source |
| Emplifi Medium |
Social Listening |
formerly Socialbakers, Facebook, Instagram, X, YouTube, web | Paid |
| Facepager Difficult |
Social Listening |
Facepager is an application for automated data retrieval on the web). It can download social media data from YouTube, Twitter, Facebook, and Amazon | Free/Open Source |
| Fanpage Karma Medium |
Social Listening |
Monitoring Facebook, Instagram, Threads, X, Linkedin, YouTube, Pinterest, WhatsApp, TikTok | Freemium |
| Flourish Medium |
Data Visualization |
Upload and visualize data using visualization templates | Freemium |
| Gephi Difficult |
Network Analysis |
Upload prepared data and visulize/analize network connections | Free/Open Source |
| Gerulata Easy |
Social Listening |
Monitoring Facebook (Pages and Groups), Twitter, Instagram, Tik-Tok, Youtube, Telegram, VKontakte, WhatsApp Channels. Monitoring and analysis of online activity, as well as the detection and tracking of disinformation and hostile propaganda campaigns. | Paid |
| Google Ad Transparency Center Easy |
Ads Monitoring |
Ads published on Google platforms (including YouTube and search), including ads on political and social issues. Includes many countries in the world | Paid |
| Google Trends Easy |
Data Source |
Indicative stats on popular Google searches in each country. | Free/Open Source |
| Hate Sonar Difficult |
Other tools | HateSonar is an hate speech detection library for Python. Allows the detection of hate speech and offensive language in text, without the need for training. | Free/Open Source |
| Hoaxy Medium |
Other tools | A tool for the visualization of conversations on social media. Incluudes support for X (via API) and for Bluesky. Can receiva input data in CSV format. | Free/Open Source |
| iMas Medium |
Data Visualization |
A platform developed to support traditional media monitoring during EU Election Observation Missions (EOMs) to promote a consistent and uniform approach to media monitoring. | Paid |
| Looker Studio Difficult |
Data Visualization |
Sofisicated tool for uploading and visualizing data using visualization templates. Integrates with Google Sheets and Microsoft Excel. Formerly called Google Data Studio. | Free/Open Source |
| Infogram Medium |
Data Visualization |
Upload and visualize data using visualization templates, including templates for several charts and tables in one visualization | Freemium |
| Junkipedia Medium |
Social Listening |
Facebook, Instagram, Telegram, TikTok, Twitter, VK, YouTube, Rumble, Truth Social, Gettr, Bitchute, Gab | |
| Linkedin Research API Difficult |
Research API |
Data on LinkedIn platform (including advertising campaigns and public posts on LinkedIn) solely for research purposes (such as research regarding ad transparency and platform safety). Access upon acceptance of the terms of service and available only for researchers. | Free/Open Source |
| Lets Data Medium |
Social Listening |
Monitoring +100M web and social channels | Paid |
| Meta Ad Library Easy |
Ads Monitoring |
Monitor ad campaigns (reach and investment) on several issues, including elections or politics | Free/Open Source |
| Meta Content Library Difficult |
Research API |
Meta Content Library and Content Library API provide access to the full public content from Facebook and Instagram. Researchers apply for access to via the Consortium for Political and Social Research (ICPSR) at the University of Michigan. | Free/Open Source |
| Meltwater Medium |
Social Listening |
Monitoring Twitter, FB, Instagram, YouTube, TikTok, Twitch, Pinterest, Reddit, blogs & forums | Paid |
| Napoleon Cat Medium |
Social Listening |
Monitring Facebook, Instagram, X, Linkedin, YouTube, TikTok, Messenger | Paid |
| Node XL Medium |
Network Analysis | Node XL is a Social Network Analysis Tool which plugs-in to Microsoft Excel (add-on) and can transform data from platforms like X (formerly Twitter), Reddit, Flickr, Wikipedia and more. Focus on network visualizations and metrics. Data is imported from platforms or from social media listening tools. | Freemium |
| NewsWhip Medium |
Social Listening |
Monitoring Facebook, Instagram (best coverage), YouTube, Pinterest, Reddit, TikTok. (Linkedin not) | Paid |
| Open Measures Easy |
Social Listening |
Tool directed at alternative social media platforms (formerly SMAT) like Truth Social, 8kun, 4chan, Bitchute, Gab, Parler, Rumble, RU Tube. Includes data from TikTok, Bluesky, Telegram and VK | Freemium |
| Phamtombuster Easy |
Social Listening |
Extract specific data from social media platforms using small programs, called "phamtoms". Phantoms available for Linkedin, Instagram, Facebook, Twitter, YouTube, Reddit, etc | Paid |
| Postman Difficult |
Other tools |
Postman is an API platform for building and using APIs | Freemium |
| Power BI Medium |
Data Visualization |
Sofisicated tool for uploading and visualizing data using visualization templates. Integrates with Microsoft Excel | Freemium |
| Python Difficult |
R/Python tool | Programming language for working with data | Free/Open Source |
| Who Targets Me Medium |
Ads Monitoring |
Doftware developed for tracking digital campaign spending | Paid |
| R Project Difficult |
R/Python tool | Programming language for working with data | Free/Open Source |
| Rawgraphs Easy |
Data Visualization |
Tool for uploading and visualizing data using visualization templates | Free/Open Source |
| PyTok Difficult |
Social Listening |
A simple Python module to collect video, text, and metadata from TikTok. | Free/Open Source |
| SentiOne Medium |
Social Listening |
Monitoring Facebook Pages and Groups; Instagram; X; YouTube; TikTok; Reddit | Paid |
| Sotrender Medium |
Social Listening |
Facebook, Instagram, Linkedin, YouTube (Telegram, TikTok and X only on higher price tier). | Paid |
| Statista Easy |
Data Source |
Compilation of data on internet and social media, worldwide and per country, with free search function | Freemium |
| Tableau Difficult |
Data Visualization |
Sofisicated tool for uploading and visualizing data using visualization templates | Paid |
| TextBlob Difficult |
Other tools | A Python library for processing textual data. Provides a simple API for diving into common natural language processing (NLP) tasks such as part-of-speech tagging, sentiment analysis and classification | Free/Open Source |
| TikTok Ad Library Easy |
Ads Monitoring |
Commercial ads published on TikTok on western countries (Europe + UK) | Free/Open Source |
| TikTok Research API Difficult |
Research API |
Monitor, analize and collect data on public content on TikTok | Free/Open Source |
| Sprout Social Medium |
Social Listening |
Monitoring Twitter, Facebook, Instagram, Linkedin, Pinterest, TikTok. Tool focused on marketing assistance. | Paid |
| Tweepy Difficult |
R/Python tool | Package of Phyton code to work with data from social media platforms, namely Twitter/X | Free/Open Source |
| Talkwalker Medium |
Social Listening |
Monitoring most important social media channels, including Linkedin | Paid |
| Tokaudit Easy |
Social Listening | Chrome and Firefox extansion to extract content from TikTok accounts | Paid |
| X API (for EU) Difficult |
Research API |
Researcher's access to X must go through the paid data API. Access for researchers porsuant to article 40 of DSA available via an application form (only for a narrow subset of EU research related to the DSA) | Paid |
| YouTube Data Tools Easy |
Social Listening |
A tool for extracting data from the YouTube platform via the YouTube API v3. Can collect data about channels, videos and searches on YouTube. | Free/Open Source |
| YouTube Research API Difficult |
Research API |
Access to global video metadata across the entire public YouTube corpus via our Data API. Access granted, via application, to acamic institutions and researchers. | Free/Open Source |
| Tweetdeck Easy |
Social Listening |
Former Tweetdeck is now part of the X Pro subscription tiers (Top Articles). The Top Articles tooll allows filtered search on X's public content and account monitoring. | Paid |
| Twint Difficult |
Social Listening | An advanced Twitter scraping tool written in Python that allows for scraping Tweets from Twitter profiles without using Twitter's API. | Free/Open Source |
Data Visualisation Tools
The goal of Monitoring Projects in election observation is to ensure consistent, objective and transparent data collection and analysis, with quantitative findings supporting qualitative assessments. Data-visualisation tools help present this information clearly, enabling both understanding and analytical insight.
A wide range of visualisation tools is available, from simple to advanced, free or paid, and standalone or integrated with databases. The table below provides a non-exhaustive overview of commonly used options. Most tools allow data to be imported from external sources or entered directly, and can be used either to create single visuals or more complex report templates.
Template variety, graphic options and user interface are the main differences between tools. For consistency, it is advisable to create all charts and tables using the same tool. Social listening platforms such as SentiOne or Brandwatch include built-in visualisation features, which can help analysts explore data, but a single dedicated visualisation tool should still be used for final reporting.
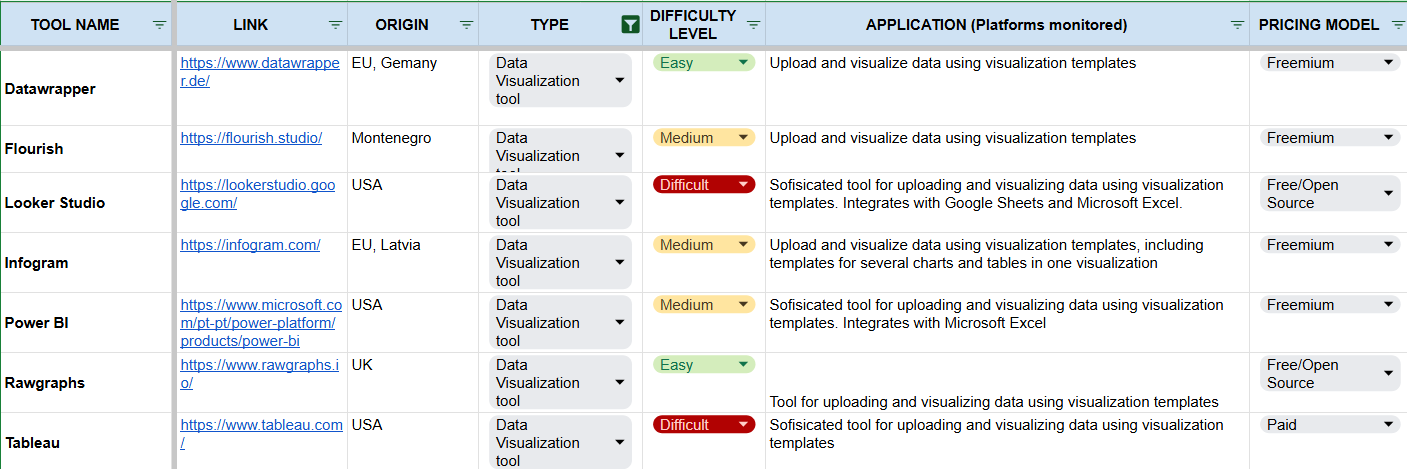
DATAWRAPPER
For EU Election Missions, EODS compartive studies recommends the use of Datawrapper for data visualisation. Developed by a European company, it is powerful, easy to use, its free version meets the needs of most missions and the paid version provides an efficient support to the experts. It also allows teams to share data, charts and tables.
Data can be copied directly into the tool or linked from Excel or Google Sheets. Users can create charts, maps and tables by choosing from a wide range of templates, or by reusing templates already created by their team. Additional guidance is available in the Datawrapper Academy section. Additionally, the River section where new charts and tables that have been used or created, is available.
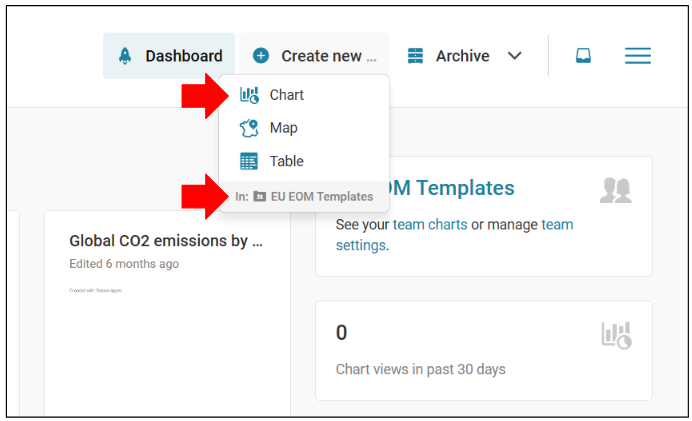
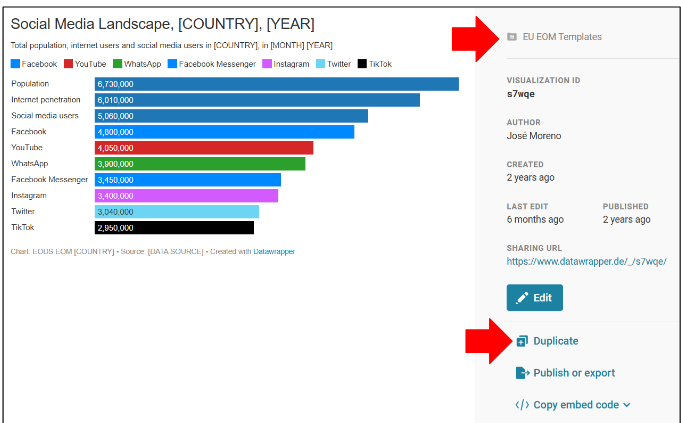
To create a chart, table or map, first upload your data. You can copy and paste it into the tool or connect an Excel file or Google Sheet. Make sure your dataset includes only the columns and rows you want to visualise. In the Check & Describe section, you can verify that the data is correct and adjust labels if needed.
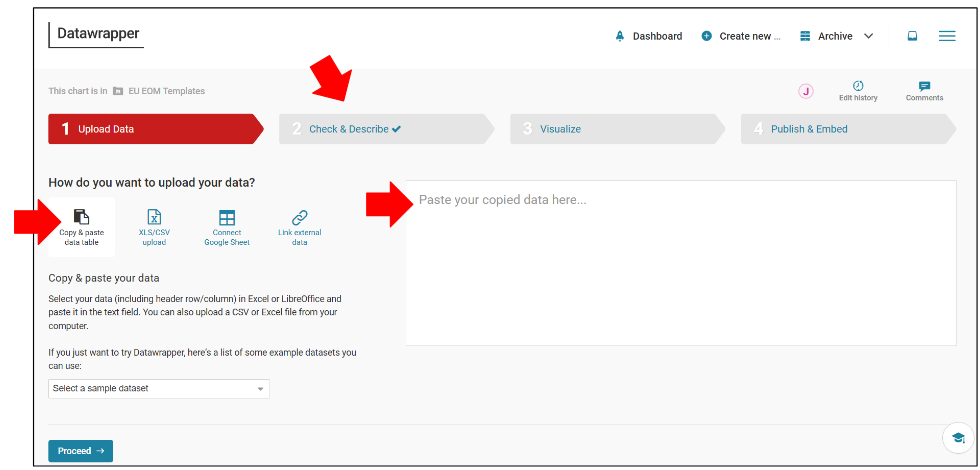
After uploading your data, select the chart or table type and preview the results. Use the Refine, Annotate, and Layout tabs to adjust the design, add a clear title, and include optional descriptions or notes. When finished, go to Publish & Embed to export the visualisation as a PNG for reports or to embed or link it online.
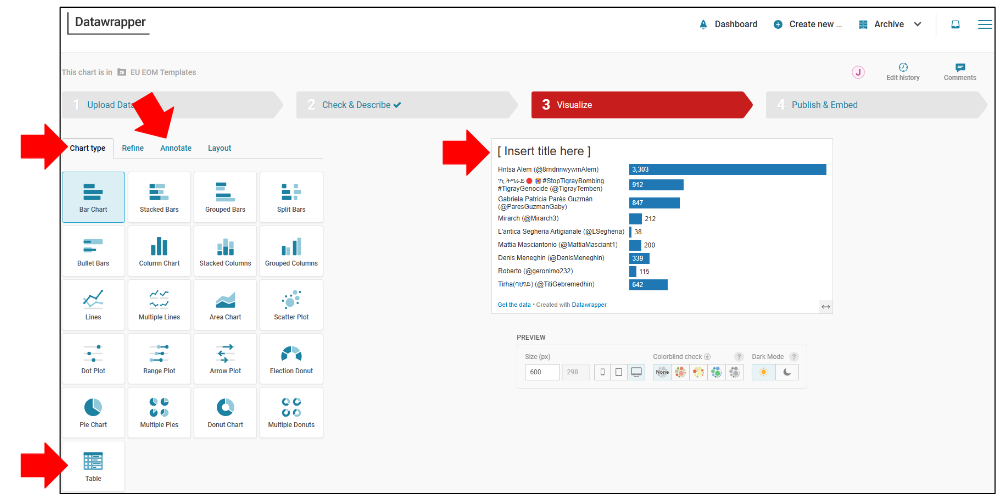
Data visualisation is the final step in your analysis. First explore and prepare your data in Excel or Google Sheets—selecting relevant columns, calculating sums or averages, or creating any needed metrics. The refined dataset is what you should import into Datawrapper.
Datawrapper can also support data exploration by letting you quickly visualise and compare different datasets using simple copy-and-paste.
Content saving tools (Archiving tools)
Saving content is essential in election observation to preserve evidence before it disappears. Whether it’s a suspicious post, manipulated website, or video that could later be deleted or altered, documentation ensures accountability and allows for verification and analysis.
Why it matters
- Platforms or actors may delete or edit content post-factum.
- Preserved content supports internal reporting and public communication.
- Screenshots alone are not reliable for validation or analysis.
- Archiving ensures replicability of findings and builds a secure case file.
Practical tips & techniques
When it comes to archiving tools and techniques it is important to understand different ways to save content, what they are best for, and how they should be used complementary, depending on your goals.
| Method | Description | Best For | Tools |
| Screenshot | Captures visible screen content with context like likes, comments, or timestamps. | Fast documentation of posts or replies. Does not include links. | Native windows / Mac shortcuts, Fireshot, ShareX, AwesomeScreenshot. |
| Screen recording | Video capture of dynamic content (e.g., Stories, Reels, disappearing posts). | Real-time posts, scrolling comment threads. | Native Android / iOS tools. |
| Full HTML archive | Saves a webpage as-is, including layout and internal links. | News sites, social media profiles. Remains publicly accessible for others as well. | https://archive.org/ – captures full HTML and links. Does not work well for social media URLs. https://archive.ph/ – faster, better for social media URLs but not always working. |
| PDF print | Converts a page into a static, printable format. | Reports, blog posts, long threads. Screenshot in PDF format. | Print pages using “Save as PDF” in your browser. Fireshot also allows to save pages as PDF. |
| Source code save | Manual copy of the HTML source (right-click > "View Source" > Save). | Emergency saving of fragile or JavaScript-heavy content. | Native in your browser. |
| Markdown/text extract | Extracts just the text and hyperlinks from a page. | Quick skimming of content, link-mapping. | URL to Markdown |
| Video/image downloader | Saves embedded or hosted videos/images. | TikTok, Instagram, YouTube, Facebook media. | TikTok - TTDown YouTube - Y2Mate Instagram, X - SaveFrom.net |
| Specific archiving services | Full investigative tool: captures, timestamps, tags, exports visits. | Comprehensive case-building and reporting. | Hunchly - 30 day free trial. |
Each tool captures a different layer of the content:
- Screenshots give you human-readable context but lack traceability.
- HTML preserve layout and URLs for technical analysis but do not always work for Social Media posts.
- Markdown extracts allow fast thematic or keyword scanning.
- Hunchly adds a forensically structured layer, great for audit trails, but only has a 30 day free trial.
Combining at least two methods—e.g., PDF + Source Code, or Markdown + Screenshot —provides both visual and technical backups and protects against content deletion, manipulation, or platform changes.
| Tool / Method | Text | Images | Videos | Metadata timestamp/likes |
Layout | Links Preserved | Dynamic Content |
| Screenshot | (visually) |
||||||
| Screen Recording | (visually) |
||||||
| Html archiving | Partial | ||||||
| Save as PDF | (visually) |
||||||
| Source code save | |||||||
| URL to Markdown | (partially) | ||||||
| Hunchly | Partial | Partial |
Organizing saved content
Finally, it is also important to organise your archived data into a structured format, that includes url source, dates and topics.
- File structure idea:
- Folder by case or incident (e.g., Eletions2025_RefutingMisinformation_PartX)
- Subfolders by source (e.g., X, YouTube, Telegram) with date (of collection) and URL.
- Filename structure: Platform__Date_URL.format
Useful Resources
This section gathers a selection of toolkits, manuals, and recent research supporting social media analysis in election observation. It features resources from other organizations, step-by-step guides on monitoring and verification, and the latest studies on the digital ecosystem. These materials offer observers and analysts broader perspectives, practical guidance and methodologies.

EODS Public Resources


EEAS FIMI Reports